Management Discussion & Analysis
and Financial Capital Formation
sOLID PROFITABLE GROWTH WAS DEMONSTRATED AS WE CROSSED lkr 300 BILLION MARK IN TOTAL ASSETS
Financial Review
NDB has made considerable strides in the Sri Lankan banking and finance sector as a leading commercial bank. Originally, being a Development Financing Institution (DFI), the Bank attained commercial banking status with the acquisition of the operations of ABN Amro NV Colombo Branch in 2001. Since the transformation in 2001, the Bank has challenged, flexed and evolved itself to become a fully-fledged commercial bank, catering to a wide spectrum of customer needs under one roof.
Reaching deeper into the financing and capital market segments of the country, the Bank has established its footprints in a host of finance related areas such as investment banking, securities trading, investment advisory, wealth management and property management through its Group entities. The amalgam of these Group Companies has created a financial structure unique to NDB. The wide range of financial services offered by the NDB Group is synonymous with a one-stop-shop of financial and capital market solutions to a multitude of customer segments such as individuals, start-up business ventures, SMEs and right up to the top-notch corporates.
2015 was characterized by several political and regulatory stances being initiated during the year, which had a mixed impact on the banking and financial services sector. The political power shift to a new regime in January 2015, passing of an Interim Budget in February 2015 by the new regime, downward revision of the policy rates of Standard Deposit Facility Rate and Standard Lending Facility Rate by 50 basis points in April 2015 and the adoption of a free float foreign exchange mechanism in September 2015 by the Central Bank of Sri Lanka were few highlights from 2015.
Amidst such macroeconomic challenges, the Bank and its Group Companies recorded solid growth levels, affirming its stance as a strong financial institution in the industry.
NDB Group Financial Performance at a Glance
| 2015 LKR million |
2014 LKR million |
2013 LKR million |
2012* LKR million |
2011 LKR million |
|
| NII | 7,807 | 7,913 | 7,012 | 5,896 | 4,910 |
| Net operating income | 12,545 | 12,437 | 10,288 | 14,887 | 8,010 |
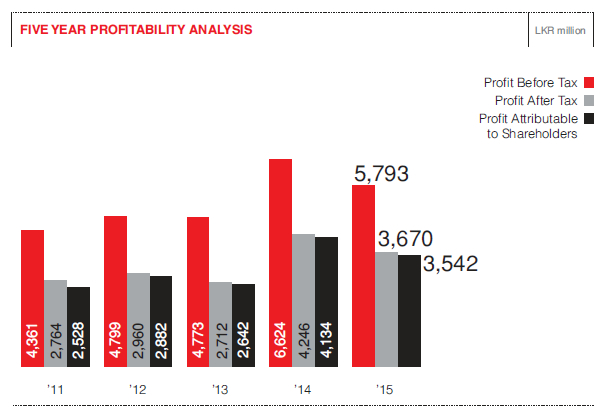
| Profit before tax on financial services and share of associate companies’ profits/(losses) | 5,793 | 6,624 | 4,773 | 10,830 | 4,361 |
| Profit after tax | 3,670 | 4,246 | 2,712 | 8,932 | 2,764 |
| Profit attributable to shareholders | 3,542 | 4,134 | 2,642 | 8,854 | 2,528 |
| Loans and receivables | 209,768 | 175,547 | 137,523 | 117,222 | 99,456 |
| Customer deposits | 184,152 | 151,485 | 129,423 | 107,394 | 82,094 |
| Total assets | 315,354 | 269,130 | 206,818 | 174,103 | 142,588 |
| Total liabilities | 285,953 | 240,331 | 181,454 | 148,394 | 124,750 |
| Shareholders funds | 28,382 | 27,876 | 24,516 | 24,883 | 16,926 |
| NPL Ratio (%) | 2.43 | 2.51 | 2.48 | 1.31 | 1.35 |
| CASA Ratio (%) | 25.61 | 24.30 | 25.20 | 23.94 | 22.86 |
| ROA (%) | 1.21 | 1.74 | 1.39 | 5.59 | 2.01 |
| ROE (%) | 12.59 | 15.78 | 10.70 | 42.35 | 15.69 |
*The one-off equity income of LKR 6,031 million in 2012 is included.
FIVE YEAR PROFITABILITY ANALYSIS
NDB Group Quarterly Financial Performance
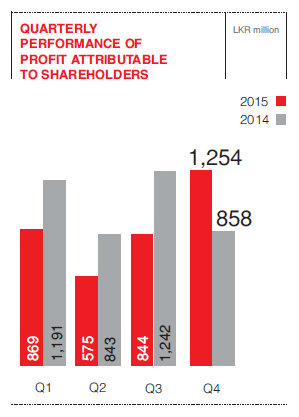
NDB Group’s quarterly financial performance has improved significantly during the latter half of the year. The political uncertainties that prevailed in the macroeconomic environment during the first half of the year, resulted in the relatively low growth levels experienced in profitability and the loans and receivables and customer deposit portfolios of the NDB Group.
| Year 2015 | 31 December LKR million |
30 September LKR million |
30 June LKR million |
31 March LKR million |
| Net operating income | 3,477 | 3,150 | 2,713 | 3,205 |
| Profit before tax | 1,674 | 1,418 | 1,010 | 1,691 |
| Profit after tax | 1,341 | 856 | 584 | 890 |
| Profit attributable to shareholders | 1,254 | 844 | 575 | 869 |
| Loans and receivables | 209,768 | 192,529 | 181,469 | 175,659 |
| Customer deposits | 184,152 | 169,040 | 169,721 | 162,428 |
| Total assets | 315,354 | 284,711 | 276,841 | 269,996 |
| Total liabilities | 285,953 | 254,655 | 247,229 | 240,943 |
| Shareholders’ funds | 28,382 | 29,113 | 28,685 | 28,098 |
QUARTERLY PERFORMANCE OF PROFIT ATTRIBUTABLE TO SHAREHOLDERS
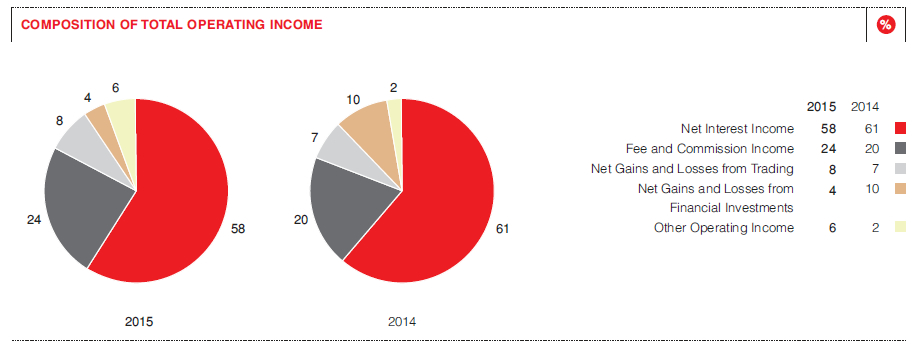
Total operating income, which is the total of Net Interest Income and Non-Interest Income, of the Bank for the 12 months ended 2015 was LKR 12,209 million, whilst the same figure at the Group level was LKR 13,291 million. The growth in Total operating income was 5% and 3%, at the Bank and Group levels, respectively.
Net Interest Income contributed 58% to the Total Operating Income of the Group for the year as compared with a 62% contribution for the year 2014. This marginal decline was primarily due to the challenging credit growth environment experienced during the year. The contribution made by each income category to the 2015 Group Total Operating Income as compared with the year 2014 is given below:
Total Operating Income
| Bank | Group | |||||||
| 2015 LKR ’000 |
2014 LKR ’000 |
Change LKR ’000 |
Change % |
2015 LKR ’000 |
2014 LKR ’000 |
Change LKR ’000 |
Change % |
|
| Net interest income | 7,521,823 | 7,674,601 | (152,778) | (2) | 7,807,377 | 7,913,405 | (106,028) | (1) |
| Non-interest income | 4,687,462 | 3,987,367 | 700,095 | 18 | 5,483,931 | 5,052,650 | 431,281 | 9 |
| Total operating income | 12,209,285 | 11,661,968 | 547,317 | 5 | 13,291,308 | 12,966,055 | 325,253 | 3 |
COMPOSITION OF TOTAL OPERATING INCOME
Net Interest Income (NII)
| Bank | Group | |||||||
| 2015 LKR ’000 |
2014 LKR ’000 |
Change LKR ’000 |
Change % |
2015 LKR ’000 |
2014 LKR ’000 |
Change LKR ’000 |
Change % |
|
| Interest income – loans and receivables | 17,171,614 | 16,807,625 | 363,989 | 2 | 17,173,884 | 16,775,036 | 398,848 | 2 |
| Interest income – placements and other investments | 3,996,234 | 4,166,953 | (170,719) | (4) | 4,258,048 | 4,376,940 | (118,892) | (3) |
| Total interest income | 21,167,848 | 20,974,578 | 193,270 | 1 | 21,431,932 | 21,151,976 | 279,956 | 1 |
| Interest expenses – customer deposits | 8,157,526 | 8,748,429 | (590,903) | (7) | 8,137,635 | 8,730,048 | (592,431) | (7) |
| Interest expenses – other borrowings | 5,488,499 | 4,551,548 | 936,951 | 21 | 5,486,920 | 4,508,523 | 978,379 | 22 |
| Total interest expenses | 13,646,025 | 13,299,977 | 346,048 | 3 | 13,624,555 | 13,238,571 | 385,984 | 3 |
| Net interest income | 7,521,823 | 7,674,601 | (152,778) | (2) | 7,807,377 | 7,913,405 | (106,028) | (1) |
| Net interest margin as a percentage of average total assets (%) | 2.63 | 3.31 | -0.68 | (21) | 2.63 | 3.31 | -0.68 | (21) |
The NII of the Bank for the twelve months ended 31 December 2015 was LKR 7,522 million. This was a LKR 153 million or 2% decrease over the NII of 2014. Whilst the interest income on loans and receivables and the interest expenses on the customer deposits had a positive impact on the Net Interest Income, there was a negative impact from the investment portfolio and the borrowings, which resulted in the marginal decrease in NII over the previous year. The increase in the interest income from loans and receivables was predominantly due to the increase in the volumes amidst pressurized interest yields. It is expected that the significant portfolio growth experienced by the Bank during the latter half of the year would benefit the Bank’s Net Interest Income during the first quarter of 2016, given the current interest rate environment.
The Bank continued its vigilant focus on balance sheet structuring, effective sourcing of funds and utilization of funds during 2015 as well. The increase of the interest expenses on borrowings by 21% was due to a public placement of a debenture and institutional foreign borrowings in line with the funding strategy adopted by the Bank, in addition to sourcing funding through customer deposits.
Net interest margin (NIM) of 2.63% based on total average assets of the Bank however, recorded a drop of 68 basis points over the prior year. Improving NIM remains a key strategic focus for the Bank.
Non-Interest Income
| Bank | Group | |||||||
| 2015 LKR ’000 |
2014 LKR ’000 |
Change LKR ’000 |
Change % |
2015 LKR ’000 |
2014 LKR ’000 |
Change LKR ’000 |
Change % |
|
| Net fee and commission income | 2,016,258 | 1,866,242 | 150,016 | 8 | 3,156,841 | 2,564,095 | 592,746 | 23 |
| Net gains from trading | 1,088,464 | 910,027 | 178,437 | 20 | 1,088,464 | 910,027 | 178,437 | 20 |
| Net gains from financial investments | 262,048 | 716,507 | (454,459) | (63) | 493,739 | 1,250,884 | (757,145) | (61) |
| Other operating income | 1,320,691 | 494,591 | 826,100 | 167 | 744,887 | 327,644 | 417,243 | 127 |
Net fee and commission income of the Bank grew by 8% to reach LKR 2,016 million, whilst the Group recorded LKR 3,157 million, a 23% growth over the previous year. Key contributors to the Bank’s Net fee and Commission Income were trade services, remittances, credit card operations and fee-based operations related to lending and deposit mobilization.
The capital market cluster of the NDB Group, whose operations are predominantly fee based, was also a key contributor to the Group’s fee-based income. Services generating fee-based income at the capital market cluster companies are equity raising activities as IPOs, debt trading activities such as debenture issuances, corporate advisory services, investment portfolio management and investment in private equities.
Net gains from trading which represents the income from foreign exchange includes gains and losses from spot and forward contracts and other currency derivatives, and was a 20% increase over the prior year.
Net gains from financial investments for the year ended 31 December 2015 was LKR 262 million at the Bank level and LKR 494 million at the Group level. The corresponding percentage decreases compared to the prior year were 63% and 61% respectively. The income is primarily from gains/(losses) from Government Debt Securities and Unit Trust Investments. The reduction in the net gains from financial investments in 2015 over 2014 was mainly due to the large marked to market gains earned during 2014. This was due to the Bank benefiting from the volatilities in the securities trading market which was a result of the relatively low interest rates that prevailed during 2014.
Other operating income recorded a notable growth at both the Bank and the Group level of 167% and 127% respectively. The growth in other income was primarily due to the higher exchange gain earned on the revaluation of the foreign currency book of the Bank due to adoption of a free float foreign exchange mechanism by the Central Bank of Sri Lanka, in September 2015.
Impairment for Loans and Receivables and Other Losses
| Bank | Group | |||||||
| 2015 LKR ’000 |
2014 LKR ’000 |
Change LKR ’000 |
Change % |
2015 LKR ’000 |
2014 LKR ’000 |
Change LKR ’000 |
Change % |
|
| Individual impairment | 561,163 | 141,432 | 419,731 | 297 | 561,163 | 141,433 | 419,731 | 297 |
| Collective impairment | 150,670 | 387,275 | (236,606) | (61) | 150,670 | 387,276 | (236,606) | (61) |
| Other losses | – | 37,294 | (37,294) | (100) | 34,312 | – | 34,312 | 100 |
| Total impairment charge for loans and receivables | 711,833 | 566,003 | 145,830 | 26 | 746,145 | 528,708 | 217,437 | 41 |
The Bank continued the adoption of the Sri Lanka Accounting Standards LKAS 32 – ‘Financial Instruments: Presentation’ and LKAS 39 – ‘Financial Instruments: Recognition and Measurement’. The computation of the impairment provisions of the Group are governed by a Board approved Impairment Policy. The Bank and the Group have in place, a robust risk management framework, which ensures an effective risk assessment process for individually significant loans and loans that are considered on a collective basis. This assessment takes into account past due status, loss data and the economic factors relevant to each portfolio segment. The impairment computation process of the Bank is continuously reviewed and improvements are effected as needed. As was in 2014, there were no significant adjustments to the provisions as a result of such improvements done during 2015.
Accordingly, impairment charges for loans and receivables and other losses of the Bank was LKR 712 million for the year ended 31 December 2015, an increase of 26% over the prior year.
The increase in the individual impairment charge was primarily due to the Bank’s prudent adoption in fair valuing the impaired loans based on sound judgment and objective evidence of future recoveries. The decrease in the collective impairment allowances, which was based on a Board approved impairment provisioning model, was primarily due to the improvement in asset quality, despite the growth in loans and receivables over the prior year.
There were no significant impairment charges for loans and receivables and other losses in the Group Companies as their portfolios contain only staff loans, which are recovered through the staff payrolls. Provisions made for other losses in the Group include impairment provisions made for fall in net assets value of Group investments.
The impairment allowances as a percentage of gross loans and receivables are given below:
| 2015 LKR million |
2014 LKR million |
|
| Impairment allowances for loans and receivables | 5,410 | 5,014 |
| Gross loans and receivables | 215,012 | 180,189 |
| Percentage of impairment allowance (%) | 2.52 | 2.78 |
Total Operating Expenses
| Bank | Group | |||||||
| 2015 LKR ’000 |
2014 LKR ’000 |
Change LKR ’000 |
Change % |
2015 LKR ’000 |
2014 LKR ’000 |
Change LKR ’000 |
Change % |
|
| Personnel expenses | 3,204,229 | 2,872,738 | 331,491 | 12 | 3,633,627 | 3,172,387 | 461,240 | 15 |
| Other expenses | 2,845,350 | 2,436,454 | 408,896 | 17 | 3,196,253 | 2,738,228 | 458,025 | 17 |
| Total operating expenses | 6,049,578 | 5,309,192 | 740,386 | 14 | 6,829,880 | 5,910,615 | 919,265 | 16 |
Total operating expenses of the Bank for the year ended 31 December 2015
was LKR 6,050 million, whilst the same
figure for the Group was LKR 6,830 million. The Bank and the Group recorded a 14% and a 16% increase in total operating expenses over the prior year, respectively.
The personnel costs of the Bank recorded a 12% growth and at a Group level the increase was 15% over the comparative year. This was mainly due to the increase in staff numbers at the Bank in line with the increase in the network and the annual remuneration increases.
Other expenses primarily include office administration and establishment expenses, depreciation of property, plant & equipment, amortization of intangible assets and deposit insurance expenses. The increase of 17% both at a Bank level and a Group level over the previous year was mainly due to the addition of ten new branches during the year and general price increases.
Operational Efficiency
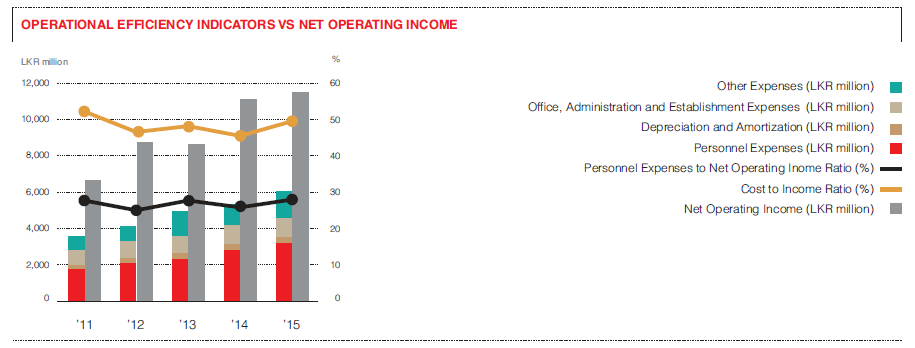
Operational excellence and cost optimization are two of the seven pillars of the Bank’s strategy spanning five years from 2014 to 2018. The execution of these strategic pillars has yielded considerable benefits in terms of cost savings and operational efficiencies.
The cost to income ratio (CIR) of the Bank for 2015 was 49.6% and compares with a CIR of 45.5% in 2014. Despite the year-on-year increase in the CIR predominantly attributable to network expansion costs, the Bank has well managed its CIR within the industry norms.
OPERATIONAL EFFICIENCY INDICATORS VS NET OPERATING INCOME
Taxation
| Bank | Group | |||||||
| 2015 LKR ’000 |
2014 LKR ’000 |
Change LKR ’000 |
Change % |
2015 LKR ’000 |
2014 LKR ’000 |
Change LKR ’000 |
Change % |
|
| Value Added Tax on Financial Services | 770,441 | 882,444 | (112,003) | (13) | 770,441 | 882,444 | (112,003) | (13) |
| Nation Building Tax on Financial Services | 140,001 | 146,806 | (6,805) | (5) | 140,001 | 146,806 | (6,805) | (5) |
| Income Tax | 1,026,002 | 1,339,459 | (313,457) | (23) | 1,212,564 | 1,348,784 | (136,220) | (10) |
Tax on financial services comprising Value Added Tax on Financial Services and Nation Building Tax on Financial Services was a total LKR 910 million for the 12 months ended 31 December 2015 at the Bank level, as well as at the Group level.
Income tax including deferred tax expenses was LKR 1,026 million for the Bank and LKR 1,213 million for the Group, for the twelve months ended
31 December 2015.
The Effective Tax Rate of the Group for the year ended was 36.6% against the total statutory effective tax rate of 42%. The predominant reason for the Group’s lower Effective Tax Rate than the statutory rate is fee-based nature of the principal activities of the subsidiaries and the investment income on unit trusts, which are exempt from income tax.
Super Gain Tax
As per the Finance (Amendment) Act No. 10 of 2015 dated 30 October 2015 an additional one-off tax named Super Gain Tax was imposed by the Government on specified corporates and individuals, for which the NDB Group was also liable. The tax liability was 25% of the taxable profits for the year of assessment 2013/14.
The total Super Gain Tax liability of the Group was LKR 854 million, which was paid in three equal tranches of LKR 285 million commencing from October 2015
to December 2015.
The Super Gain Tax liability for the Group was accounted and paid through the retained earnings at the beginning of the year.
Profit Attributable to Shareholders (PAS)
The PAS for the year was LKR 3,542 million and the contribution from the core banking operations and the Group share of profits for the year 2015 was 74% and 26% respectively.
Total Comprehensive Income for the Year
| Bank | Group | |||||||
| 2015 LKR ’000 |
2014 LKR ’000 |
Change LKR ’000 |
Change % |
2015 LKR ’000 |
2014 LKR ’000 |
Change LKR ’000 |
Change % |
|
| Profit for the year | 3,511,431 | 3,418,064 | 93,366 | 3 | 3,670,095 | 4,245,972 | (575,875) | (14) |
| Total other comprehensive income | (513,191) | 1,127,051 | (1,640,242) | (146) | (385,936) | 1,140,692 | (1,526,628) | (134) |
| Total comprehensive income for the year | 2,998,240 | 4,545,115 | (1,546,876) | (34) | 3,284,159 | 5,386,664 | (2,102,503) | (39) |
Total other comprehensive income (OCI) of the Bank was a negative LKR 513 million as compared with an income of LKR 1,127 million for the previous year. The Bank revalued its land and building during the year 2014, which resulted in revaluation gains before tax of LKR 1,084 million. The loss from total other comprehensive income for the year 2015 mainly includes temporary marked to market losses on the Bank’s investments portfolio classified as ‘Available-for-Sale’.
Accordingly, the total comprehensive income of the Bank for the year was LKR 2,998 million as compared with LKR 4,545 million for the previous year and the decline of 34% was due to the reasons explained above.
Statement of Financial Position
| Bank | Group | |||||||
| 2015 LKR ’000 |
2014 LKR ’000 |
Change LKR ’000 |
Change % |
2015 LKR ’000 |
2014 LKR ’000 |
Change LKR ’000 |
Change % |
|
| Total assets | 309,157,605 | 262,729,146 | 46,428,459 | 18 | 315,353,733 | 269,129,605 | 46,224,132 | 17 |
| Loans and receivables | 209,704,701 | 175,486,347 | 34,218,354 | 19 | 209,768,193 | 175,547,050 | 34,221,143 | 19 |
| Investments | 73,876,704 | 69,137,786 | 4,738,918 | 7 | 77,257,188 | 72,970,513 | 4,286,675 | 6 |
| Total liabilities | 286,456,747 | 240,490,954 | 45,965,796 | 19 | 285,953,016 | 240,331,186 | 45,621,830 | 19 |
| Customer deposits | 184,933,230 | 151,823,715 | 33,109,515 | 22 | 184,152,280 | 151,485,201 | 32,667,079 | 22 |
| Debt securities issued and other borrowed funds | 60,527,844 | 61,955,460 | (1,427,616) | (2) | 60,497,844 | 61,925,802 | (1,427,957) | (2) |
| Subordinated term debts | 19,573,883 | 11,149,439 | 8,424,444 | 76 | 19,573,883 | 11,149,439 | 8,424,444 | 76 |
| Shareholders’ funds | 22,700,858 | 22,238,192 | 462,664 | 2 | 28,382,204 | 27,875,773 | 506,430 | 2 |
Total Assets
The Bank recorded a growth of 18% in total assets as at the year-end over the corresponding year end. Accordingly, the total asset base crossed the LKR 300 billion mark to reach LKR 309 billion. This growth rate is a close replication of the industry wide assets growth for the year 2015. The Group’s total asset base also reached LKR 315 billion (a year on year growth of 17%) by the end of the year.
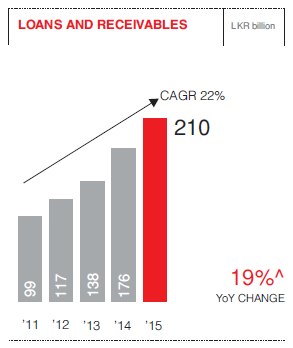
Loans and Receivables
Loans and receivables net of impairment allowances was a commendable growth of 19% at the Bank, to reach LKR 210 billion as at 31 December 2015. Whilst all business segments contributed towards this growth of LKR 34 billion, project and infrastructure financing loans, SME loans, leasing and other consumer lending products, were the main contributors.
The Bank is committed to improving its business volumes through innovative and effective product features within a constrained interest margin environment. The Bank continues to nurture the surging industries in the Sri Lankan economy, with special focus on a host of emerging SME ventures.
Customer Deposits
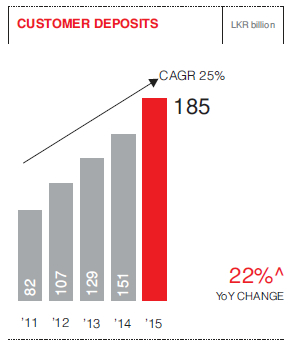
Customer deposits also recorded a commendable growth of 22% to reach LKR 185 billion. This was a LKR 33 billion increase over the prior year.
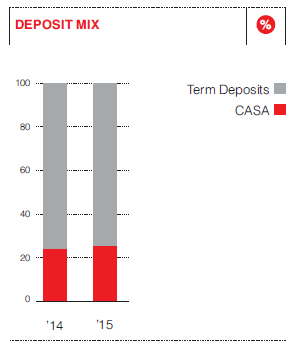
The Current Accounts and Savings Accounts (CASA) ratio of the Bank improved to 26% by the end of 2015 from a CASA ratio of 24% in 2014. The Bank intensified its efforts in expanding its low cost deposit base comprising of current and saving accounts during the year. Streamlining the Bank’s savings deposit products into two broad clusters of ‘Easy Saver’ and ‘Big Saver’ from which customers are able to choose savings accounts which suit their income and saving patterns was a major initiative rolled-out during the year. The campaign is led by the slogan ‘Savings solutions – For you to choose from’. Furthermore, the Bank conducted CASA boosting initiatives amongst the staff members as well.
NDB’s commercial banking
operations have been in existence for just over 10 years. Prior to obtaining commercial banking status, the Bank was predominantly financed through institutional credit funds. As such the Bank’s conversion from a zero CASA status to its current level over a short span of ten years is commendable. Furthermore, with the planned aggressive expansion of the operations of the Bank, the CASA ratio is expected to further improve, deriving the
benefits of enhanced interest margins for the Bank.
Debt Securities Issued and Other Borrowed Funds
Debt securities issued and other borrowed funds include concessionary credit lines and refinancing borrowings and institutional borrowings.
The Bank’s Institutional Borrowings include, borrowing from DEG (Deutsche Investitions – und Entwicklungsgesellschaft GmbH), FMO (Nederlandse Financierings-Maatschappij voor), IFC – International Finance Corporation and Proparco which is a partially-owned Subsidiary of AFD (Agence Française de Développement). During the year 2014, the Bank entered into an agreement with Proparco and FMO for a syndication loan of USD 75 million, and commenced draw down in 2015.
Under the IFC Syndication loan, the Bank received a total of USD 200 million in 2014, out of which the Bank successfully repaid USD 105 million in March 2015, at the end of the twelve month maturity. The remaining two tranches of USD 20 million and USD 75 million, continue to be in operation for a tenor of 7 years. The Bank entered into a SWAP agreement with the Central Bank of Sri Lanka to minimize the foreign exchange risk on these loans and the agreement will be reviewed each year, over the tenor of the loan.
Funds received from institutional borrowings were infused to finance small and medium-sized enterprises and infrastructure-related projects.
Subordinated Term Debts
During the year, the Bank issued rated unsecured redeemable debentures with a face value of LKR 10 billion. The debentures were issued in two types – one issued at par value carrying a coupon of 9.4% p.a. and the other issued at a discounted price as zero coupon bonds. Both types of debentures were issued with a maturity period of five years.
In addition to the above debentures, the Bank’s subordinated debt comprises the rated debentures issued in December 2013, and other subordinated institutional debt. Accordingly, total subordinated debt of the Bank as at end 2015 was LKR 19.6 billion. All of these subordinated debts qualify for Tier II capital of the Bank as per Basel guidelines and as approved by the Central Bank of Sri Lanka.
More information on the Bank’s listed and unlisted debentures is available in the Investor Relations Section.
Total Shareholders’ Equity
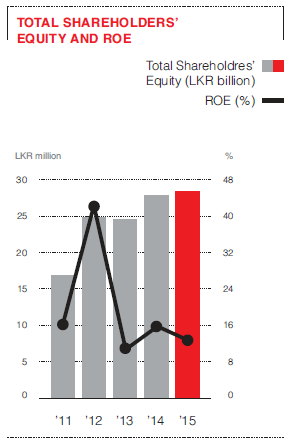
Total shareholders’ equity of the Bank and the Group stood at LKR 22.7 billion and LKR 28.4 billion respectively as at the end of 2015. The movement in shareholders’ equity over the previous year primarily includes the profit attributable to shareholders for the year net of the final dividends paid for the year 2014 and the interim dividend payment for the year 2015.
Group Return on shareholders’ funds (ROE) was 12.59% for the year ended 31 December 2015 and compares with a ratio of 15.78% for the previous year.
TOTAL SHAREHOLDERS’ EQUITY AND ROE
Asset Quality
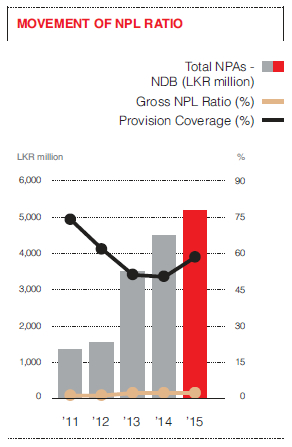
Non-Performing Loan ratio (NPL) of the Bank improved to 2.43% as at 31 December 2015 from 2.51% as at the previous year-end. The Bank has consistently maintained its NPL ratio well below the industry average, and the improvement in the ratio over the prior year is a clear reflection of the strong reviewing, monitoring and recovery processes which exist within the Bank over its credit portfolios. The Bank’s NPL cover, which is a percentage of specific provisions made as per the time based provisions mandated by the Central Bank of Sri Lanka over the Gross Non-Performing Loans of the Bank, was 58.7% by the end of 2015. The Bank has maintained a sound NPL coverage over the years, as depicted below:
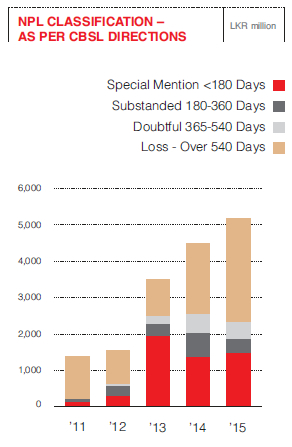
Given below is an analysis of the Bank’s non-performing loans based on the credit risk classification of the Central Bank of Sri Lanka.
NPL CLASSIFICATION – AS PER CBSL DIRECTIONS
Capital Adequacy
| Bank | Group | |||
| 2015 | 2014 | 2015 | 2014 | |
| Eligible Tier I capital – LKR million | 20,018 | 19,888 | 27,154 | 26,952 |
| Eligible Tier II capital – LKR million | 9,596 | 9,044 | 10,263 | 9,659 |
| Capital base (Tier I + Tier II) | 29,614 | 28,932 | 37,417 | 36,611 |
| Tier I capital adequacy ratio (%) | 8.51 | 10.09 | 11.07 | 12.92 |
| Tier I & Tier II capital adequacy ratio (%) | 12.59 | 14.68 | 15.25 | 17.55 |
A strong capital base has been NDB’s long-standing strength. Whilst the Bank’s and the Group’s capital is nourished by regular profits, the Bank also paid consistent dividends in line with the Bank’s dividend policy. The Bank has well understood the need for additional capital in order to support its business expansion and will ensure that this remains a strategic priority for the year 2016.
A detailed calculation is given on the capital adequacy section.
Liquidity
| 2015 % |
2014 % |
|
| Statutory liquid ratio – DBU | 22.24 | 23.85 |
| Statutory liquid ratio – FCBU | 24.91 | 25.18 |
| Regulatory minimum for statutory liquid ratio (DBU& FCBU) | 20.00 | 20.00 |
The Bank has consistently maintained its liquidity levels well above the regulatory requirements. Beyond the regulatory minimum, the Bank takes conscious efforts to strike the optimum balance between liquidity and profitability in managing its operations.
Shareholder Return Indicators
A detailed discussion on the key shareholder return indicators is available in the Investor Relations section.
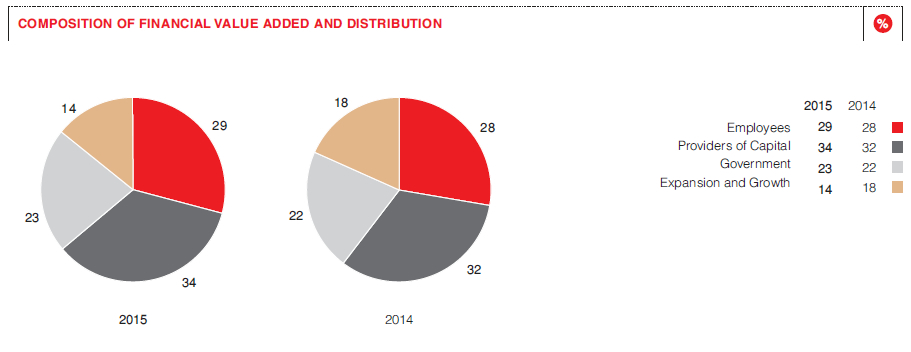
Financial Value Added
The Bank is engaged in the creation and distribution of financial value through its operations. Amongst the beneficiaries of such value distribution are employees, providers of capital, the Government of Sri Lanka and the community at large. In addition to the external distribution of value created, a certain portion is retained within the business for expansion and growth purposes.
Presented below is a five-year analysis of the Bank’s financial value addition and distribution:
Financial Value Added and Distribution
| 2015 | 2014 | 2013 | 2012 | 2011 | ||||||
| For the year ended December 31 | LKR million | Change % |
LKR million | Change % |
LKR million | Change % |
LKR million | Change % |
LKR million | Change % |
| Value added | ||||||||||
| Income from banking services | 24,924 | 24,518 | 23,556 | 19,448 | 13,306 | |||||
| Cost of services | (14,250) | (13,998) | (15,858) | (13,038) | (8,282) | |||||
| Value added by banking services | 10,674 | 10,520 | 7,698 | 6,410 | 5,023 | |||||
| Non-banking income | 931 | 444 | 6,100 | 754 | 228 | |||||
| Impairment charges for loans and receivables and other losses |
(712) | (566) | (1,238) | (106) | (68) | |||||
| Total | 10,893 | 10,398 | 12,560 | 7,058 | 5,184 | |||||
| Distribution of value added | ||||||||||
| To employees | ||||||||||
| Salaries and other benefits | 3,204 | 29 | 2,873 | 28 | 2,389 | 19 | 2,173 | 31 | 1,838 | 35 |
| To providers of capital | ||||||||||
| Dividends to equity holders | 1,815 | 1,978 | 3,222 | 657 | 880 | |||||
| Interest to debenture holders | 1,840 | 1,378 | 95 | – | – | |||||
| Total to providers of capital | 3,655 | 34 | 3,356 | 32 | 3,317 | 26 | 657 | 9 | 880 | 17 |
| To Government | ||||||||||
| Income tax | 872 | 1,213 | 854 | 1,023 | 792 | |||||
| Financial Services VAT | 770 | 882 | 911 | 622 | 505 | |||||
| Nation Building Tax | 140 | 147 | – | – | – | |||||
| Corporate Insurance Levy | 23 | 24 | 77 | – | – | |||||
| Super gain tax | 732 | – | – | – | – | |||||
| Total Government | 2,537 | 23 | 2,266 | 22 | 1,842 | 15 | 1,645 | 23 | 1,297 | 25 |
| For expansion and growth | ||||||||||
| Retained profit | 964 | 1,440 | 4,501 | 2,267 | 951 | |||||
| Depreciation/amortization | 370 | 323 | 302 | 265 | 227 | |||||
| Deferred taxation | 154 | 127 | 194 | 38 | (17) | |||||
| Total for expansion and growth | 1,488 | 14 | 1,890 | 18 | 4,997 | 40 | 2,570 | 36 | 1,160 | 22 |
| To community investments | ||||||||||
| Donations | 8 | 13 | 14 | 13 | 9 | |||||
| Total to community | 8 | 0 | 13 | 0 | 14 | 0 | 13 | 1 | 9 | 0 |
| Total distributed | 10,893 | 100 | 10,398 | 100 | 12,560 | 100 | 7,058 | 100 | 5,184 | 100 |
COMPOSITION OF FINANCIAL VALUE ADDED AND DISTRIBUTION
Economic Value Addition
Economic Value Addition (EVA) is defined as the excess value created over the required return of the Bank’s investors who comprise shareholders and debtholders. EVA is a measurement of profit distinct from that of financial profit. The Bank well recognizes the importance of this concept hence computes and presents the Economic Value Added by the Bank for the financial year under review, as well as four prior years as given below:
| For the year ended December 31 | 2015 LKR million |
2014 LKR million |
2013* LKR million |
2012 LKR million |
2011 LKR million |
| Invested Equity | |||||
| Shareholders’ funds | 22,701 | 22,238 | 19,620 | 14,942 | 12,675 |
| Add: Allowance for impairment charges for loans and receivable | 5,517 | 5,121 | 4,379 | 2,972 | 3,029 |
| Total | 28,218 | 27,359 | 23,999 | 17,914 | 15,704 |
| Earnings | |||||
| Profit after tax and dividend on preference shares | 3,511 | 3,418 | 7,723 | 2,924 | 1,831 |
| Add: Impairment changes for loans and receivables and other losses | 712 | 566 | 1,238 | 106 | 68 |
| Less: Loan losses written-off | (34) | (64) | (76) | (67) | (6) |
| Total | 4,189 | 3,920 | 8,885 | 2,963 | 1,893 |
| Cost of equity (Based on 12 months weighted average T-bill rate plus 2% for risk premium) |
8.63% | 10.24% | 12.63% | 14.02% | 9.50% |
| Cost of average equity | 2,398 | 2,630 | 2,647 | 2,357 | 1,386 |
| Economic value addition | 1,791 | 1,291 | 6,238 | 607 | 506 |
* The one-off equity income of LKR 6,031 million in 2013 is included.
Performance of Business Units
The discussion thus far reviewed the overall performance of the Bank and the Group in the context of financial value creation and capital formation. Given below is a more detailed review of the financial performance of the Bank’s principal lines of business, namely, commercial banking, Islamic banking, project & infrastructure financing, retail banking, micro & SME financing and treasury followed by a snapshot of the group companies.
Commercial Banking
The commercial banking arm of the Bank, plays an important role in providing comprehensive working capital solutions to large and medium size businesses in the country. More recently, our services have expanded to include facilities for local companies to expand their businesses in overseas markets such as the Maldives, Bangladesh and Uganda.
Strategic Focus
In line with national growth strategies, our commercial banking activities during the year covered loans to companies in sectors such as construction, property development, agriculture (including tea, paddy and related crops), business process outsourcing (BPO) and tourism. Going beyond the traditional large and medium sectors, we have included Distributor Financing and Supplier Financing to our product portfolio. This strategic initiative expands our commercial banking reach indirectly to the rural sector through our branch network by facilitating financial solutions down the entire value chain.
Performance
Our commercial banking products include import and export loans, guarantees, overdraft, short-term loans and advanced treasury products. Accompanied with seamless processes and a professional relationship management team, the business caters to the growth of existing and new customers.
The low interest regime and squeeze in interest margins that prevailed during the year, shifted our focus to volume growth. The continuation of sanctions on Iran and Syria together with the unfavourable economic and political situation in the Middle Eastern and former Soviet bloc countries, had a negative impact on the export sector, resulting delays in collections and slowdown in business. Local banks in turn were thus affected by extended and restructured credit and stretched working capital cycles.
The commercial banking asset portfolio grew by 5% during 2015 (2014:11%), while the liability base grew by 36% (2014: 3%), with the CASA ratio maintained at a favourable level of 31%.
However, total income recorded a 16% YoY decline in 2015 (2014: 3% growth). Net interest income (NII) decline 20% (2014: 3% decline), while fee-based income saw a 9% decline (2014: 4% decline), which tilted the NII: Fee ratio from 69% in 2014 to 67% in 2015. As in the past five years or more, the cost to income ratio was kept below 28%.
The non-performing loans were adversely affected mainly due to some changes in the textile and garment sector resulting from external issues on which the Bank had no control.
Commercial Banking – Key Performance Indicators
| Indicator | 2015 LKR million |
2014 LKR million |
YoY Change % |
| Income | 2,816 | 3,367 | (16) |
| Profit before tax | 968 | 2,672 | (64) |
| Profit after tax | 581 | 1,603 | (64) |
| Non-performing loans |
2,081 | 629 | 231 |
| Cost to income ratio (%) |
27.7 | 23.8 | 16 |
| Total loans and receivables |
79,301 | 75,796 | 5 |
Adaptation of ‘SLAS 36 - Impairment of Assets’ on a monthly basis has further enabled the Bank to identify the early warning signals along many angles. We maintain a proactive approach in addressing possible delays and non-repayment of loans and take necessary action where required.
Outlook
The new economic policies of the Government and improved international relations create optimism for greater foreign direct investments (FDI). While exploiting new business opportunities, our attention will be on exports, construction and agriculture sectors in the near term. Further, in an environment of low interest rates and tight net interest margins, a determined effort will be made to grow fee-based income.
Geared by ISO 9001: 2008-certified Corporate Banking and Trade Finance Departments, implementation of the 5-S methodology, a state-of-the-art electronic banking system and an expanded correspondent banking network, the Bank’s commercial banking business looks forward to 2016 with optimism.
Project and Infrastructure Financing
With its roots firmly embedded in development banking, our project & infrastructure finance (PIF) business completed yet another successful year in providing long-term financing to corporate customers.
Strategic Focus
As part of Bank’s overall strategy, PIF formulated its strategic direction for the next five years in the latter part of 2013 and it was revalidated in 2015. PIF executed the said strategy successfully by implementing key strategic initiatives through approving 8 overseas projects totalling to a value of USD 87 million and by disbursing LKR 7.4 billion to domestically funded infrastructure projects.
Performance
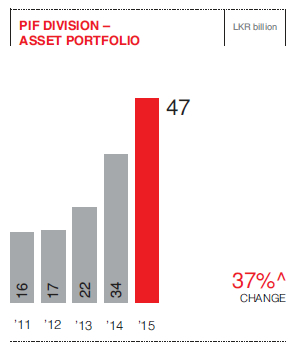
Year 2015 was challenging, due to the continued low interest rate regime that saw net margins of financial institutions being stressed to an unprecedented level. Nevertheless, PIF completed a satisfactory year with a 37% asset book growth.
PIF functions on a long-term relationship model with a customer centric approach which focuses on fundamental understanding of their businesses. This, together with qualified, multidisciplinary and experienced staff, have been our key success factors.
The term loans/leases and securitizations accounted for approximately 82% and 11% of the total asset portfolio at the end of 2015 respectively, while investments in debentures accounted for the balance 7%.
Our first Islamic long-term financing solution (Diminishing Musharakah), was approved and disbursed during the year.
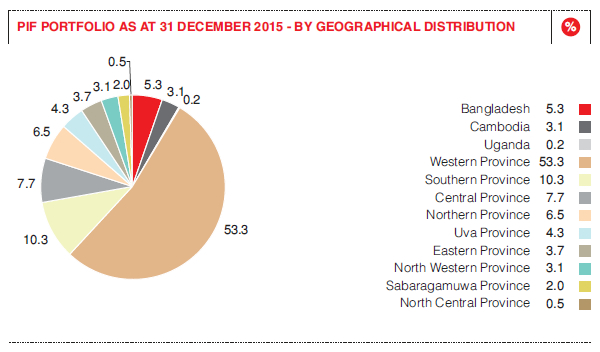
PIF DIVISION – ASSET PORTFOLIO
PIF PORTFOLIO AS AT 31 DECEMBER 2015 - BY GEOGRAPHICAL DISTRIBUTION
Overseas lending activities contributed to 9% of the total assets of the PIF as at 31 December 2015. These include a large facility to a thermal power plant in Bangladesh, a manufacturing facility in Uganda and an ‘inclusive financing’ project in Cambodia. Further, another thermal power plant in Bangladesh, a hydropower project in Uganda and a strategic infrastructure rehabilitation project in the Maldives were approved during the year which are expected to fuel the next years’ portfolio growth.
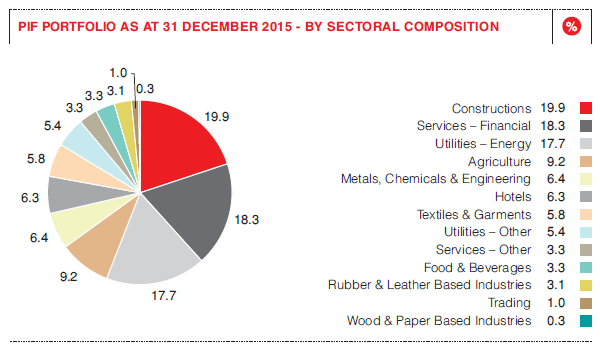
PIF PORTFOLIO AS AT 31 DECEMBER 2015 - BY SECTORAL COMPOSITION
PIF – Key Performance Indicators
| Indicator | 2015 LKR million |
2014 LKR million |
YoY Change % |
| Income | 3,706 | 3,297 | 13 |
| Profit before tax | 642 | 356 | 80 |
| Profit after tax | 407 | 235 | 73 |
| Non-performing loans | 176 | 558 | (69) |
| Cost to income ratio (%) | 38 | 32 | 18 |
| Total loans and receivables and investments | 46,709 | 34,024 | 37 |
A substantial reduction in NPL ratio from 1.7% to 0.4% was achieved by reviving a significantly large leisure sector project.
Outlook
The stressed net interest income margins scenario is likely to remain as a challenge for all financial institutions during the year ahead. While seeking to increase the share of fee-based income sources and optimally managing costs, the Bank will search for avenues for sourcing matching funds to finance long tenure accommodations.
PIF will continue to look for opportunities in the global arena, to finance projects of established offshore corporates. Further, as a responsible financial partner, financing power projects, that applies novel technologies of harnessing energy through renewable sources, would be favorably considered by PIF. The Bank is also set to become a strong force in providing long-term Islamic banking solutions.
Retail Banking
The Bank ventured into retail banking during 2005. From a modest beginning we have made vast strides in providing retail banking services to all segments of customers in the country, while seamlessly complementing other products and services offered by the Bank and the Group.
Strategic Focus
Given its appeal to a broad customer base, our retail banking business often serves as the ‘face’ of the Bank, taking forward the NDB brand name to all parts of Sri Lanka. This aspect assumes strategic importance for the Bank and the Group as the Bank launches its ‘brand refresh’ campaign with the tag line ‘our commitment,
your success’.
Performance
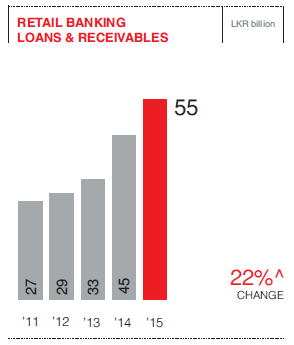
Retail banking assets grew by 22% during the year to reach LKR 55,225 million, with all products recording growth. This was largely achieved through the Bank’s ability to play a financial advisory role to customers rather than merely offering a sales proposition.
RETAIL BANKING LOANS & RECEIVABLES
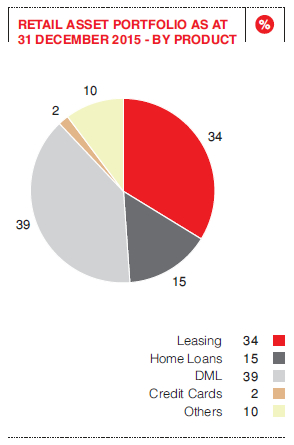
In composition terms, our ‘Dream Maker’ loan (DML), lead the way with a share of 39%, followed by auto finance at 34%.
RETAIL ASSET PORTFOLIO AS AT 31 DECEMBER 2015 - BY PRODUCT
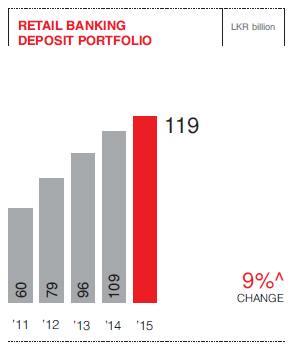
The low levels of interest rates in the market hindered the growth of deposits for the entire banking industry. Nevertheless, we addressed the challenge proactively and grew our CASA portfolio by 22% during the year.
RETAIL BANKING DEPOSIT PORTFOLIO
SME Banking
The small and medium enterprises (SME) comprise an important sector for the country, which makes considerable contribution to the country’s GDP and is a key driver in creating employment opportunities in both the formal and informal sectors.
Strategic Focus
The Bank’s goals are aligned with the national objective of developing the SME sector, and like micro financing, it complements our ‘operational CSR’ goals. Our strategic response includes customer empowering initiatives, new product development, alliances with grass root organizations and accessing targeted lines of credit from multilateral and bilateral funding agencies.
Performance
The SME loan portfolio increased by 40% from LKR 21 billion to LKR 29.5 billion during the year. Profitability of the SME Banking Unit also improved in tandem.
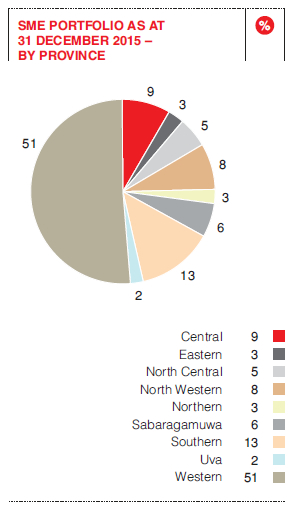
SME PORTFOLIO AS AT 31 DECEMBER 2015 – BY PROVINCE
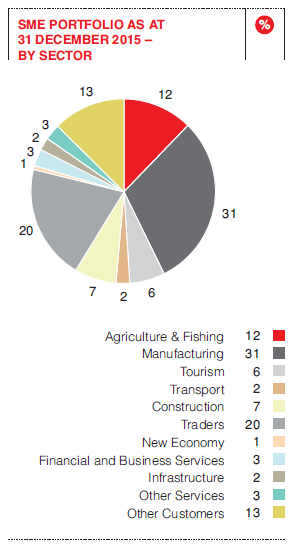
SME PORTFOLIO AS AT 31 DECEMBER 2015 – BY SECTOR
Outlook
The Bank is well positioned to grow its presence in the SME sector in 2016. It will be supported by access to concessionary lines of credit such as the SMEDeF of the World Bank and the SMILE III revolving fund implemented by the Ministry of Industry and Commerce.
Retail Banking and SME – Key Performance Indicators
| Indicator | 2015 LKR million |
2014 LKR million |
YoY Change % |
| Income | 4,851 | 3,692 | 31 |
| Profit before tax | 669 | 47 | 1,323 |
| Profit after tax | 402 | 28 | 1,336 |
| Cost to income ratio (%) | 85.6 | 86.5 | (1) |
| Total loans and receivables | 84,848 | 65,984 | 28 |
| Customer Deposits | 119,173 | 109,278 | 9 |
| Non-performing loans | 2,071 | 2,049 | 1 |
| CASA Ratio (%) | 26 | 23 | 2.7 |
Micro Financing
The Bank’s micro finance business, launched in mid 2013, gathered growth momentum during the year with emphasis on credit quality and risk mitigation.
Strategic Focus
The entry into micro financing complements the Bank’s operational CSR goals based on financial inclusion. Our approach is primarily through pilot projects that are scalable and structured programmes, such as the Citi CCCS Rural Empowerment Programme launched in 2015. We also include the urban side, as in the Bank’s collaboration with the Colombo Municipal Council and the Sri Lanka Food Processing Association to upgrade the quality standards of street food vendors of the Galle Face Green.
Performance
The micro financing operations also enhanced during the year with an increase in volumes and profitability.
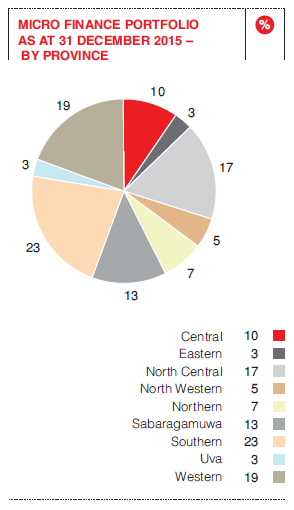
MICRO FINANCE PORTFOLIO AS AT 31 DECEMBER 2015 – BY PROVINCE
In terms of industry sector, agriculture, agribusiness and fishing dominates the portfolio (48%) followed by retail business (25%) and trading (9%).
Outlook
The Bank will continue to work on current initiatives, introduce refinements and scale up operations with a view to mainstreaming the micro projects financed. New initiatives too will be added, focused on our overarching goal of financial inclusion and empowerment.
Islamic Banking
The Bank launched Islamic banking in August 2014 under the brand name ‘Shareek’, which means ‘partner’. All operations of the Islamic banking unit are in accordance with the Central Bank of Sri Lanka (CBSL) guidelines and are in conformity with the Shariah principles, including the segregation of fund management operations and earnings from our conventional banking activities. The Bank has appointed a Shariah advisory panel comprising well-respected and eminent Shariah scholars with extensive knowledge of the local and international markets.
Strategic Focus
The increasing demand for ethical investments and alternative financing in Sri Lanka has resulted in an annual growth rate of around 15% in the Islamic financial service industry. This growth has not only stemmed from Muslim followers and Islamic faith, but from Non-Muslims as well. The Bank’s entry into this growth sector thus complements our diversification strategy through innovative financial solutions.
Performance
NDB Shareek is led by a well trained team. Located at the head office, it serves customers from across the Bank’s network through a unique Islamic banking platform. NDB Shareek provides sharia based lending and investment options to serve the customers financial needs.
Outlook
NDB Shareek has successfully garnered a growing client base and turned around to a profitable business unit in a short period of time. We see considerable potential to grow in the years ahead and become a significant contributor to the Bank’s bottom line.
Treasury
The Bank’s Treasury unit is a specialized service provider catering to corporate, institutional SME and retail investors. Treasury operations comprise two aspects, one which covers foreign exchange, money market and ALM operations to generate profit, whilst the other taking on the responsibility for managing the interest rate risk, foreign exchange risk and liquidity risk of the Bank.
Strategic Focus
Amidst a depreciating Sri Lanka Rupee (LKR) and a steepening yield curve, Treasury was called to focus on its dual role of revenue generation and risk mitigation, with emphasis on interest rate and liquidity risk management aspects. The slowing down experienced in China, the second largest economy in the world, and the anticipated US Federal reserve rate hikes were external impacts that needed a strategic response.
Performance
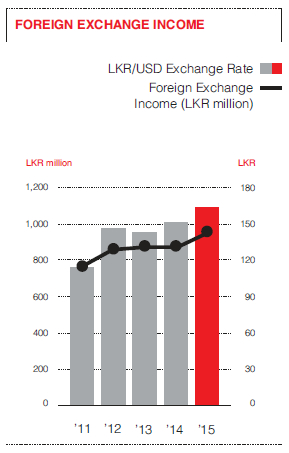
China devalued its Yuan on multiple occasions in an attempt to maintain its economic momentum, thus sending signals of a dangerous looking financial crisis seemingly across the Asia Pacific region. The Central Bank of Sri Lanka followed suit soon after to cease the Dollar selling intervention on the Sri Lankan Rupee and administered a ‘free float’ of the Rupee in September 2015, which resulted in a Rupee depreciation for the year of 9% and the USD/LKR spot closing on 144. The Euro, Sterling Pound and Australian Dollar depreciated against the greenback during the year providing the volatility which on the right footing provided ample trading (revenue) opportunities.
The yield curve was poised for a stable flat trajectory owing to the low stable inflation numbers. But due to significant outflows of foreign investment from the Government Securities market during the second half of 2015 (China factor and anticipated high USD gilt rates), the yield curve steepened with medium to long-term tenors (3 to 15 years GOSL bonds) adjusting upward by an average of between 150 to 250 basis points.
Building on its strength as a dominant ‘market maker’, Treasury focused on extending its position in the FX market by providing a variety of products and services to institutional, corporate, individual as well as interbank clients. Plain vanilla FX forwards, FX derivatives, dual currency deposits, FX options, FX swaps were offered to a wide spectrum of clientele with the focus on import/export-related transactions.
Asset and Liability Management
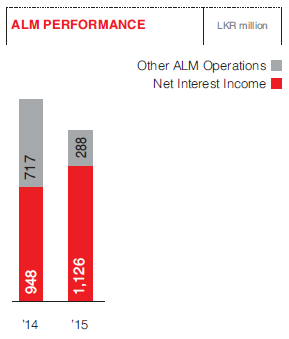
The Asset and Liability Management (ALM) unit focused on enhancing revenue through interest rate risk management. Gapping was optimally utilized with accurate forecasting of yield curve shifts to enhance revenue. Debt trading volumes were not as pronounced as in the previous year as yields were pushed upward, but negative impacts on the portfolio were mitigated through proactive duration management of the available-for-sale (AFS) and trading securities portfolios. Treasury Bills, Treasury Bonds, repurchase agreements, commercial papers, debentures and interest rate swaps were offered to clients who required debt-related products. Continued emphasis on capital planning and liquidity management saw the rupee debenture issue of LKR 10 billion and a USD 75 million institutional funding along with demand, term deposits and money market funds providing a solid base for balance sheet growth. The ALM unit contributed revenue of LKR 1,414 million for 2015.
FX Desk
The rupee depreciation enabled the foreign exchange desk to capitalize on the opportunities made available. Imports which were on the rise until the Rupee depreciation, did allow for import-related volume growth. Post depreciation witnessed a decline in overall trading volumes. However, the exchange volatility prevalent provided ample opportunities to enhance trading revenue during the last quarter. The volatility in the cross currency majors was exploited to make sizeable trading gains. The FX desk recorded trading revenue of LKR 793.3 million, while FX sales recorded LKR 335.1 million revenue for 2015.
Treasury - Key Performance Indicators
| 2015 LKR million |
2014 LKR million |
YoY Change % | |
| Foreign Exchange Income | 1,088 | 910 | 20 |
| Net Interest Income | 1,126 | 948 | 19 |
| Other ALM Operations | 289 | 717 | -60 |
Outlook
Accelerated demand for credit growth during the last quarter of 2015 and the monetary policy tightening by way of an enhanced reserve requirement for Licensed Commercial Banks has formulated the backdrop for the interest rate environment in 2016. Medium-term interest rates are expected to move upward during 2016 driven by tighter monetary policy. The success of revenue generation and fiscal policy implementation proposed through the budget will hold the key in determining the degree on interest rate movements. Balance of payment and current account position has continued to impose strain on the exchange rate running up to 2016. The exchange rate depreciation will not be as pronounce as in 2015 but is expected to depreciate around 5% to 6% depending on the success of the BOP management.
Treasury has managed to forecast accurate indications of interest rates and the exchange rate leading up to 2016 and has positioned the balance sheet accordingly. The anticipated upward yield movements will harvest maximum revenue based on the positioning of the mismatches created. Treasury will continue to explore dynamic avenues to assert itself as a leader in innovative product solutions catering to evolving retail and wholesale client requirements.
Performance of the Capital Market Cluster
As detailed under Organizational Profile, the direct operational subsidiaries of the Bank comprise NDB Capital Holdings Ltd. (NCAP), NDB Capital Ltd. (Bangladesh) and Development Holdings (Private) Ltd. (DHPL). The Bank’s indirect subsidiaries are through NDB Capital Holdings Ltd., and comprise NDB Investment Bank Ltd. (NDBIB), NDB Wealth Management Ltd. (NWM), NDB Securities (Pvt) Ltd. (NDBS), NDB Zephyr Partners Ltd. (Mauritius) (NDBZ) and NDB Zephyr Partners Lanka (Pvt.) Ltd.
Among these operational subsidiaries, all except DHPL are identified as the investment banking cluster. The performance of the local investment banking cluster should be viewed in context with the operating environment that prevailed during the year.
NDB Capital Holdings Ltd.
Strategic Focus
The capital market cluster of the Group is focused on fund-based and fee-based investment banking, wealth management, stock broking and private equity management. The overarching goal of the cluster is to provide a full range of investment banking services in the country with special emphasis on product innovation and value creation for our clients and shareholders.
NCAP is involved in both fee based operations as well as fund-based operations. The main fee-based operations of NCAP are carried out through its subsidiaries NDBIB, NWM, NDBS and NDBZ, while NCAP takes on the direct participation in fund based operations including but not limited to investments in listed equities, private equity and fixed income securities.
The complementary role of the investment banking cluster thus makes the NDB Group a leading integrated financial services provider in the country with a diversified product and service portfolio spanning both commercial banking and investment banking.
Performance
Given the volatile market conditions which prevailed in the country and the global economic conditions, NCAP reduced its equity exposure during the year. Such a tactical asset allocation decision mitigated the adverse impacts, while the negative performance of NCAP’s listed equity portfolio was partially offset by the attractive returns from some of the structured equity investments made previously.
The dismal performance in the equity market impacted the performance at NDBS which is solely dependent on market conditions. However, both NDBIB and NDBWM achieved commendable profitability levels.
Despite the lower than expected performance, the NCAP Group continued to invest in training and development programmes for staff, recognizing the importance of its employee capital to this knowledge driven business.
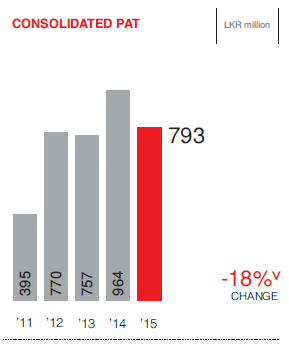
The consolidated profit after tax of the investment banking cluster was LKR 793 million, a decline of 18% from LKR 964 million in 2014.
Note: The 2012 profit is adjusted for the one off capital gain reported from divestiture of AIA Insurance, while that of 2013 is adjusted for the impact on profits due to investment income earned from the aforesaid capital gain due to the divestiture of AIA.
Investment Banking Cluster – Key Performance Indicators
| Indicator | 2015 | 2014 | YoY Change % |
| Total operating income (LKR million) | 1,576 | 1,417 | 11 |
| Profit after tax (LKR million) | 793 | 964 | (18) |
| Return on equity (%) | 12 | 16 | (25) |
| Operating profit margin (%) | 57 | 64 | (11) |
| Net profit margin (%) | 50 | 68 | (26) |
Outlook
The investment banking cluster will focus on achieving and maintaining its leadership position in investment banking, asset management and private equity management within the country. It will be a driving force for policy formulation at national level for the capital markets in Sri Lanka.
NDB Investment Bank
Strategic Focus
NDBIB, the investment banking arm of the NDB Group, offers fee-based services ranging from debt and equity products, corporate advisory services to mergers and acquisitions.
Performance
NDBIB reaffirmed its dominance in the capital market by successfully raising LKR 60 billion through a combination of debentures, securitizations, commercial paper, long-term facilities and equity. It also amassed an unparalleled 55% market share in the listed debenture space, leaping ahead of its competitors.
Some of the key transactions executed during the year include the following:
- Upon completion of the acquisition of Resus Energy PLC (REP) by a consortium of investors facilitated by NDBIB in late 2014, NDBIB has been involved in a string of transactions with the REP Group including the mandatory offer triggered by the said acquisition. The financial restructuring of the REP Group was subsequently carried out under the guidance of NDBIB including share repurchases, capital reductions and dividend payments at both REP and subsidiary levels. The REP Group raised LKR 950 million via a syndicated loan facility to enable the said financial restructuring for which NDBIB played a key role as arranger and financial advisor. The financial restructuring successfully unlocked the value of the Group’s assets whilst generating attractive returns to the shareholders.
- Raised USD 6 million through a syndicated loan facility for the development of a resort hotel in the Maldives.
- As financial advisor and manager, raised LKR 3 billion through a debenture issue for MTD Walkers PLC, the first listed debenture in the local construction industry.
- NDBIB acted as joint financial advisor and manager to the very successful LKR 750 million IPO of People’s Insurance Ltd. which was over subscribed by several times.
- NDBIB was active in the M&A space by advising on an acquisition involving two key apparel manufacturers in the country creating a much focused and strengthened apparel group. The transaction, valued at USD 25 million, was facilitated by NDBIB who played an imperative role as financial advisor to the divesting shareholders. The transaction was structured to include consideration in the form of cash as well as in shares.
NDBIB – Key Performance Indicators
| Indicator | 2015 | 2014 | YoY Change % |
| Funds raised (LKR billion) |
59 | 25 | 142 |
| Profit after tax (LKR million) |
169 | 61 | 175 |
| Operating profit margin (%) |
58 | 36 | 61 |
| Net profit margin (%) | 45 | 36 | 25 |
| Return on equity (%) | 29 | 12 | 142 |
Outlook
With the ensuing political stability following the August 2015 parliamentary elections, NDBIB is of the view that both debt and equity markets would regain momentum subsequent to the unveiling of the economic policies of the new Government. We expect foreign investments to flow in to the country once there is policy level clarity due to the attractive growth rates forecast for the economy compared to most emerging and frontier markets in the region. The team at NDBIB is well equipped to continue its dominance as the leading Investment Bank in the country to support the development to be undertaken by both public and private sectors.
NDB Wealth Management Ltd.
Strategic Focus
NWM offers three distinct services:
(i) Discretionary Portfolio Management for large institutions such as insurance companies, provident funds and corporates; (ii) Private Wealth Management catering to high net worth individuals, and (iii) a series of risk rated Mutual Funds to meet the wealth planning needs of the retail mass market. Despite the uncertainty in the capital and the money markets that prevailed during the year NWM’s research driven investment strategy helped clients to broadly steer clear of the volatility.
Performance
Activities during the year focused on Private Wealth Management and further development of our unique financial product - the ‘ONE Account’. This is a product that combines a current account, a credit card and a money market investment account, bringing about a convergence of banking and capital markets.
NWM ended the year with over 5,000 clients and LKR 93 billion of client funds under management. NWM’s capital of LKR 666 million versus the regulatory minimum capital of LKR 25 million indicates the strength of the Company and NDB Group’s commitment to the business of wealth management.
NWM – Key Performance Indicators
| Indicator | 2015 | 2014 | Change % |
| Assets under management (LKR billion) |
93 | 87 | 7 |
| Profit after tax (LKR million) |
157 | 197 | (20) |
| Return on equity (%) |
26 | 43 | (17) |
Outlook
We believe the ‘ONE Account’ will be a trend setter in Sri Lanka as a financial product and with new and exciting features being continuously added to provide clients truly cutting edge banking. As technological advances continue to permeate society, NWM will be alert in understanding the strategic implications and respond accordingly. Innovation will be the central focus going forward. Thus, our introduction of a new web portal and a downloadable app with the capability of providing clients financial analysis tools, account statements, online application forms and even games with attractive prizes for winners are just the beginning.
NDB Securities (Pvt) Ltd.
Strategic Focus
NDBS provides a platform to its institutional and retail clients to access the capital market in Sri Lanka through its listed equity and debt trading platform. This is supported by a number of related value added services such as state-of-the-art online trading facilities for speedy trade executions, margin trading and other credit facilities through its parent NDB Bank and comprehensive coverage of research to support trading activities.
NDBS differentiates itself from competition through cutting edge IT systems that enhance customer service, sound research and analytics (both personalized as well as through publications) and its ability to serve both equity and debt investment needs of clients.
Performance
Despite challenging market conditions that prevailed in 2015 both globally and locally, NDBS recorded profit before tax of LKR 26.4 million (2014: LKR 35.4 million), making NDBS one of the few stock broking companies to record a profit for the year. Further, NDBS was successful in gaining market share by increasing its equity market share from 3.69% in 2014 to 4.15% in 2015 through various promotions and forums executed.
NDBS - Key Performance Indicators
| Indicator | 2015 | 2014 | Change % |
| Profit after tax (LKR million) |
18 | 26 | (31) |
| Net profit margin (%) | 11 | 16 | (29) |
| Return on equity (%) | 6 | 8 | (32) |
| Market share (%) | 4.15 | 3.69 | 12 |
Outlook
Going forward, NDBS aims to increase its foreign client base. It has been successful in promoting Sri Lankan equities amongst foreign investors having conducted several investor road shows in Malaysia and Singapore. NDBS will also look at increasing its presence in the listed debenture market which we believe should become more liquid with the expected development in the capital markets in the country. Leveraging our links with the NDB Group, we also see opportunities to increase cross selling of Group products under the NDB brand. This makes NDBS a total financial services provider with a competitive advantage over peers in our industry.
NDB Capital Ltd. (Bangladesh)
Strategic Focus
NDB Capital Ltd. (NDB Capital) is the investment banking arm of the Group which is domiciled in Bangladesh, providing corporate advisory services and performing capital and debt raising activities for large corporates and financial institutions. The Company has been successful in creating a niche market for itself in the country by being the only merchant bank offering such innovative products and carrying out a number of milestone investment banking transactions.
Performance
The excess liquidity in the market, availability of low cost short-term funding and an outlook of further reduction in interest rates diluted the requirement for long-term debt instruments. The focus during the year was mainly on providing corporate advisory services and equity raising.
Some of the key activities of NDB Capital during the year included:
- Arranging funds through a local currency syndication for an auto brick project under the Green
Project financing initiative of the Central Bank. - Facilitating the entry of a Sri Lankan finance company and a construction company into Bangladesh through equity participation.
- Providing fee-based corporate advisory services to foreign investors.
- Disbursing a foreign currency project loan through both local and offshore financing for a power company in Bangladesh promoted by a leading
Sri Lankan energy company, along with the arrangement of their working capital facility.
NDB Capital had a good year in 2015 and recorded a revenue of over BDT 50 million, an increase of 350% over the previous year. In tandem the profit after tax of BDT 8.01 million achieved is the highest in the last four years of operation.
NDB Capital – Key Performance Indicators
| Indicator | 2015 | 2014 | YoY Change % |
| Revenue, BDT million |
52 | 11 | 350 |
| Profit/(loss) after tax BDT million |
8 | (31) | 126 |
Outlook
The low interest rate regime is expected to continue in the market for a few more years, which would pave the way of increased investment. Having secured mandates for innovative deals and a robust pipeline, NDB Capital is expected to build on the synergies with its parent in order to contribute to the Group’s profitability.
NDB Zephyr Partners Ltd. (Mauritius)
Strategic Focus
NDB Zephyr Partners Ltd. (NDBZ) is jointly owned by NDB Capital Holdings Ltd. (NCAP) (60%) and Zephyr Management, LP (Zephyr) (40%), a New York-based global emerging markets investment firm. NDBZ is the fund manager of the Emerald Sri Lanka Fund which makes private equity investments in Sri Lanka-based small and medium businesses seeking capital for expansion.
NDBZ has identified the key issues faced by SMEs that hinder their growth. The lack of collateral denies them access to traditional bank finance, while they have limited equity raising options until an IPO, and many SMEs are not ready for an IPO, due to the size of business, lack of management depth and inadequate governance.
NDBZ fills this void by assisting its portfolio companies in areas such as strategic planning, management development, improving financial management, corporate governance and improving operational efficiencies in addition to providing equity capital. Companies are selected based on their unique value proposition and a sustainable growth potential through a comprehensive, due diligence process. Exit of such investments will be via IPOs or through trade sales to domestic or international buyers.
Performance
NDBZ has so far evaluated a large number of companies in different sectors such as financial services, manufacturing, leisure, healthcare, education and FMCG. Negotiations are presently going on with a non-bank finance company, a construction related company and an education service provider. NDBZ has also approached many SMEs in Sri Lanka and is in the process of educating the Sri Lankan businesses on private equity as an alternative financing mechanism.
Commencing operations in December 2014, NDBZ recorded a turnover of USD 850,000 (approximately LKR 119 million), a profit before tax of USD 132,854 (approximately LKR 18 million) and a profit after tax of USD 123,203 (approximately LKR 17 million) during 2015.
Outlook
Amidst the expected rebound in the economy, supported by the political stability and favourable policy measures, NDBZ plans to complete several investments during 2016. The team’s reputation in the industry and the strong brand recognition developed so far is expected to help NDBZ in maintaining a healthy and balanced deal pipeline. Furthermore, the team’s knowledge acquired through active participation in local and international transactions will benefit NDBZ in selecting good investments which will enhance shareholder returns.
Performance of the Property Management Arm
Development Holdings (Private) Ltd.
Strategic Focus
Development Holdings (Private) Ltd. (DHPL) is the property management arm of the Group and has rented out the 16-storied high rise commercial property which is the NDB-EDB Tower for business purposes. This property is jointly managed by the Bank and the Sri Lanka Export Development Board (EDB) and it houses the offices of the Sri Lanka Export Development Board (EDB), several departments including the Navam Mawatha branch of the Bank and several other renowned local and global institutions.
The Tower features a magnificent view of the Beira Lake along with a fully-fledged auditorium capable of many amenities which includes capacity to seat 250 people, ample parking space and a cafeteria which can accommodate 200 people at a time.
Performance
DHPL currently has 100% occupancy and recorded a net profit of LKR 277 million for the year. The revenue generated from rental income and fair value of the investment property amounted to LRK 305 million for the year.
Outlook
DHPL will ensure that the tenants are provided with enhanced facilities to carry out their business activities and maintain high standards with necessary upgrades to position itself as a high rise commercial property with greater demand.