Highlights of the year
| BANK | GROUP | |||||
| 2015 LKR ’000 |
2014 LKR ’000 |
Change % |
2015 LKR ’000 |
2014 LKR ’000 |
Change % |
|
| Operating results for the year | ||||||
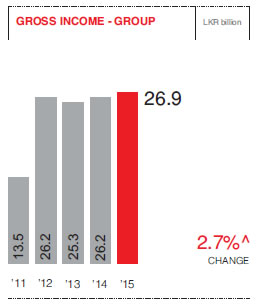
| Gross income | 25,855,311 | 24,961,945 | 4 | 26,915,863 | 26,204,626 | 3 |
| Operating profit before tax on financial services | 5,447,875 | 5,786,773 | (6) | 5,715,283 | 6,526,732 | (12) |
| Taxation | 1,936,444 | 2,368,709 | (18) | 2,123,006 | 2,378,034 | (11) |
| Profit after tax | 3,511,431 | 3,418,064 | 3 | 3,670,095 | 4,245,972 | (14) |
| Profit attributable to shareholders | 3,511,431 | 3,418,064 | 3 | 3,542,040 | 4,133,932 | (14) |
| Gross dividends for the year | 1,816,841 | 1,814,865 | – | 1,816,841 | 1,814,865 | – |
| Revenue to Government | 2,537,372 | 2,266,237 | 12 | 2,826,548 | 2,297,111 | 23 |
| Assets and liabilities | ||||||
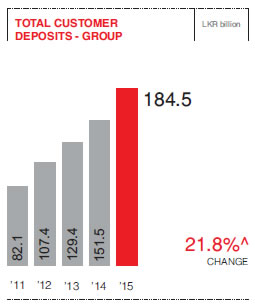
| Customer deposits | 184,933,230 | 151,823,715 | 22 | 184,152,280 | 151,485,201 | 22 |
| Loans and receivables | 209,704,701 | 175,486,347 | 19 | 209,768,193 | 175,547,050 | 19 |
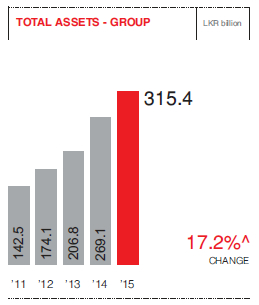
| Total assets | 309,157,605 | 262,729,146 | 18 | 315,353,733 | 269,129,605 | 17 |
| Total liabilities | 286,456,747 | 240,490,954 | 19 | 285,953,016 | 240,331,186 | 19 |
| Shareholders’ funds | 22,700,858 | 22,238,192 | 2 | 28,382,204 | 27,875,773 | 2 |
| Profitability (%) | ||||||
| Net interest margin | 2.63 | 3.31 | (21) | 2.67 | 3.33 | (20) |
| Non-performing loans ratio | 2.43 | 2.51 | (3) | 2.43 | 2.51 | (3) |
| Return on assets | 1.23 | 1.47 | (16) | 1.21 | 1.74 | (30) |
| Return on equity | 15.63 | 16.33 | (4) | 12.59 | 15.78 | (20) |
| Total leverage (times) | 13.62 | 11.81 | 15 | 11.11 | 9.65 | 15 |
| Investor information (LKR) | ||||||
| Net asset value per share | 137.44 | 134.70 | 2 | 172.35 | 169.35 | 2 |
| Market value per share - as at 31 December | 194.10 | 250.00 | (22) | NA | NA | – |
| Earnings per share - basic | 21.26 | 20.72 | 3 | 21.51 | 25.14 | (14) |
| Earnings per share - diluted | 21.26 | 20.70 | 3 | 21.51 | 25.11 | (14) |
| Price earnings (times) | 9.13 | 12.07 | (24) | NA | NA | – |
| Dividend per share | 11.00 | 11.00 | – | NA | NA | – |
| Dividend cover (times) | 1.93 | 1.88 | 3 | NA | NA | – |
| Dividend yield (%) | 5.67 | 4.40 | 29 | NA | NA | – |
| Market capitalisation (LKR ’000) | 32,058,981 | 41,273,481 | (22) | NA | NA | – |
| Regulatory ratios (%) | ||||||
| Capital adequacy ratio | ||||||
| Tier I – (minimum ratio of 5%) | 8.51 | 10.09 | (16) | 11.07 | 12.92 | (14) |
| Tier I & II – (minimum ratio of 10%) | 12.59 | 14.68 | (14) | 15.25 | 17.55 | (13) |
| Statutory liquid asset ratio | ||||||
| DBU | 22.24 | 23.85 | (7) | – | – | – |
| FCBU | 24.91 | 25.18 | (1) | – | – | – |
Financial Goals and Achievements
| Goals | Achievements | |||||
| Financial indicators - Bank | 2015 | 2014* | 2013* | 2012 | 2011 | |
| Return on assets (%) | Over 1.5% | 1.23 | 1.47 | 1.14 | 1.94 | 1.50 |
| Return on equity (%) | Over 17% | 15.63 | 16.33 | 14.38 | 21.17 | 15.01 |
| Growth in total operating income (%) | Over 20% | 4.69 | 19.00 | 11.55 | 31.00 | 15.45 |
| Growth in profit after taxation (%) | Over 20% | 2.73 | 64.00 | -29.00 | 60.00 | 31.52 |
| Growth in total assets (%) | Over 20% | 17.67 | 31.00 | 23.00 | 18.00 | 31.61 |
| Dividend per share (LKR) | Over 10 | 11.00 | 11.00 | 10.00 | 15.00 | 7.50 |
| Capital adequacy ratios: Tier I (%) - Minimum requirement 5% | Over 8% |
8.51 |
10.09 |
12.05 |
11.14 |
9.98 |
| Tier I & II (%) - Minimum requirement 10% | Over 13% | 12.59 | 14.68 | 17.87 | 12.38 | 11.26 |
* The above achievements are presented excluding the one-off equity income of LKR 6,031 million for the year 2013.