Investor Relations
For many corporates, the scope of interaction with investors is confined to Annual General Meetings, Annual Reports and dividend declarations. An entity's attention, wider engagements and interactions, intentionally or not, are more focused on stakeholder groups such as customers and suppliers. It is seldom that they make conscious efforts to engage their shareholders and investors throughout the year.
At NDB, our stance towards investors is different. For us, investors are as important as any other stakeholder group. They have been the unwavering strength of the Bank as it has propelled and prospered forward to become one of the leading financial institutions in the country. The Bank has very well understood the importance of well-informed and well-engaged investors. As such, investor relations have become a well-organized function within the Bank alongside other day-to-day operations, with a dedicated team in conducting best in class investor relations, coming under the direct purview of the Chief Executive Officer and the Group Chief Financial Officer.
Our investor relations endeavours are a strong proponent of maintaining accessibility to the management, quality, transparency and fairness in disclosures, elimination of selective disclosures and consistency in investor relations endeavours in all conditions.
Affirming the strides NDB has made in its investor relations endeavors, in 2015, the Bank was recognized with a Silver Award at the CFA Sri Lanka Capital Market Awards. NDB was the Bronze Award winner for the same award in 2014.
Investor Relations Activities - 2015
| Activity | Level of Engagement |
| Annual General Meeting | NDB hosted its 10th Annual General Meeting in March 2015, for the year 2014. |
| One-to-one investor meetings | The Bank hosted over 60 investor meetings over the year. All these meetings have been chaired by the CEO, Group CFO or Vice President Finance & Planning. |
| Investor Fora | The Bank hosted two large scale investor fora during the year for the full year financial performance for 2014 and the first nine months financial performance of 2015. |
| Investor webinars | The CEO hosted four online investor webinars during the year for the financial performance of 2014 and financial performance of Q1, 2 and 3 of 2015, for local and overseas shareholders and analysts. |
| NDB's representation at overseas investor fora | The Bank proudly represented Sri Lanka at the following key overseas investor fora held in 2015, amongst others;
|
| Annual and quarterly statements lodged to the CSE | During 2015, the Bank timely lodged the Annual Financial Statements for the financial year 2014 and the Financial Statements from Q1 to Q3 of 2015. The Financial Statements were also complimented with a performance commentary for the benefit of the users of the Financial Statements. |
| Annual and quarterly press releases on the financial performance of the Bank and Group | The Bank published press releases during 2015, on the financial performance for the financial year 2014 and the quarters 1 to 3 in all three languages of Sinhala, English and Tamil. |
| Email alert on financial results release | As per established practice, the Bank released an email notification to investors, analysts, fund managers, etc.* just after the quarterly/annual the financial results were released to the CSE. |
| Reaching to investors through a revamped web page | The Bank maintains a dedicated web page for investors in its corporate website structured in a user-friendly and easy to navigate format and presents a wide array of investor information. |
| SMS alert and CEO's comments on the release of the Annual Report | NDB initiated a novel feature, combining investor relations and Annual Report in 2014, where an SMS alert was released to investors and a host of other recipients on the release of the Bank's Annual Report to the CSE. The SMS alert also directed the recipients to a short video hosted by the CEO where he commented on the financial performance of 2014. |
*For the purpose of communications, the Bank maintains a comprehensive contact database of current shareholders and investors, fund managers, stock and investment analysts, professionals representing rating agencies and other relevant personnel who will benefit from the Bank's communications.
Dates of investor-related events such as releasing Financial Statements to the CSE, investor fora, investor webinar, etc. held during 2015 as well as scheduled for 2016 are available in the Financial Calendar.
Securities in Issue NDB
- Quoted ordinary shares
- Debentures
- Listed rated unsecured subordinated redeemable debentures issued in December 2013
- Listed rated unsecured subordinated redeemable debentures issued in June 2015
- Unlisted debentures issued in June/July 2011
Ordinary Shares
1. Features of Ordinary Shares
| Security Type | Quoted Ordinary Shares |
| Listed exchange | Colombo Stock Exchange (CSE) - Main Board |
| Featured stock indices | All Share Price Index (ASPI), S&P (SL) 20 Index Bank, Finance & Insurance Index (BFI) |
| CSE stock symbol | NDB.N0000 |
| ISIN | LK0207N00007 |
| Bloomberg newswire code | NDBB |
| Reuter's newswire code | NBLK |
2. Stock Markets Performance and NDB Share Performance - 2015
2.1 Performance of Global Equity Markets
2015 was a torrid year for global equity markets with losses being recorded in several key indices. Developed markets were hard hit, with the S&P 500 (USA), FTSE 100 (UK), S&P ASX 200 (AUS) and Hang Seng (HK) all recording losses. Supported by a weakening Yen (which investors expected would boost exports) and dovish monetary policy, the Nikkei 225 (JPN) was one of the few bright spots in equity markets, recording a gain of approximately 9% during the year. On a surprising note, despite capturing global headlines due to high volatility for most parts of the year, the Shanghai Shenzen CSI 300 index (CHN) also ended the year with a gain of over 5%.
2.2 Performance of the Colombo Stock Exchange
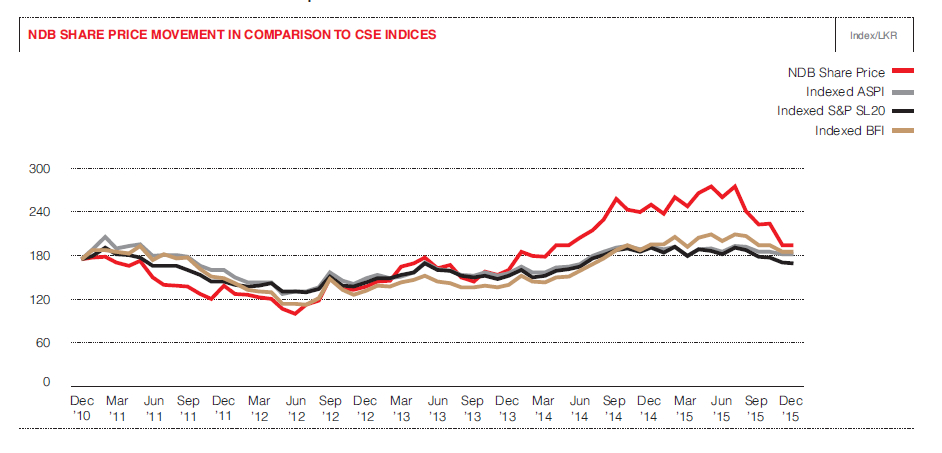
During 2015, the the All Share Price Index (ASPI) dropped 5.54% while the larger market cap index, S&P SL20 dropped by 11.33%. The equity market activity remained subdued in the first half of 2015 with the exception witnessed immediately after presidential elections and pre-general elections as investor sentiment improved based on expected political stability. However, towards the end of the year the ASPI was seen tumbling down due to adverse global and local conditions on equity. During the year, CSE was able to record an LKR 1.06 billion, average daily turnover. Net foreign selling of LKR 5.37 billion was witnessed in 2015 compared to a net foreign buying of LKR 21.14 billion in 2014.
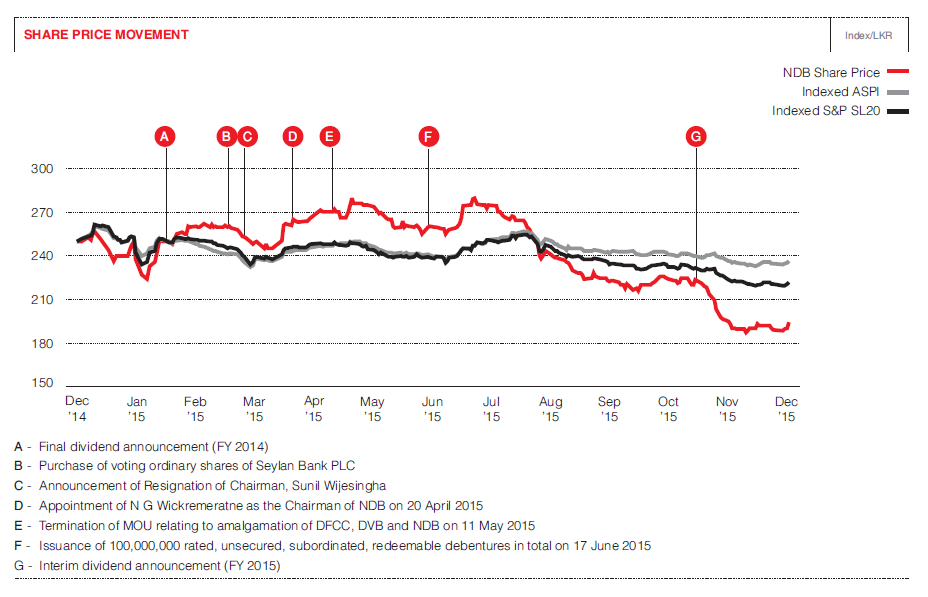
2.3 Performance of the NDB Share
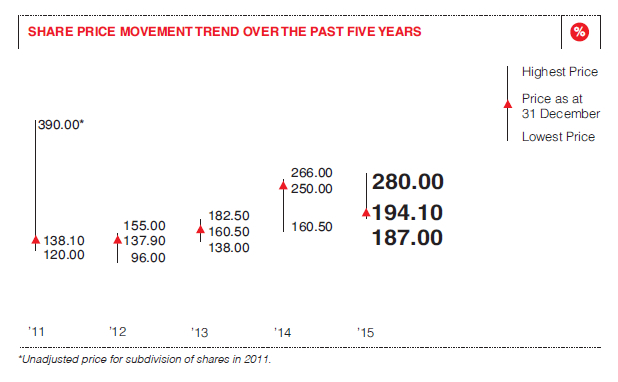
The NDB share price declined by 22.4% to close at LKR 194.10 by end of 2015. During the year, the share reached a high of LKR 280.00 (in May and July 2015) and a low of LKR 187.00 (in December 2015). The NDB share followed a similar trend to the ASPI with NDB declining further than the broader index towards the end of the year. This was due to the local and global conditions that adversely affected local equity and some tax proposals which were proposed in the fiscal budget for the year 2016, which impacted the banking sector.
On 13 November 2015, NDB announced an interim dividend of 2015 of LKR 7.00 per share and same was paid in November 2015. Further the, final dividend for 2015 of LKR 4.00 per share was announced on 12 February 2016 to be paid on 24 February 2016.
3. Analysis of Ordinary Shareholders as at 31 December 2015 as Per Rule 7.6 (x) of the Listing Rules of the CSE
3.1 Distribution of shareholders
| As at 31 December 2015 | As at 31 December 2014 | |||||||
| Shareholding Range | No. of Shareholders |
% | No. of Shares |
% | No. of Shareholders |
% | No. of Shares |
% |
| 1 - 1,000 | 5,245 | 66.30 | 1,728,113 | 1.04 | 5,039 | 62.88 | 1,693,820 | 1.03 |
| 1,001 - 10,000 | 2,236 | 28.27 | 7,110,788 | 4.31 | 2,536 | 31.64 | 8,047,949 | 4.87 |
| 10,001 - 100,000 | 346 | 4.37 | 9,317,220 | 5.65 | 351 | 4.38 | 9,678,179 | 5.86 |
| 100,001 - 1,000,000 | 56 | 0.71 | 18,440,324 | 11.16 | 59 | 0.74 | 18,393,531 | 11.14 |
| Over 1,000,000 | 28 | 0.35 | 128,570,897 | 77.84 | 29 | 0.36 | 127,280,443 | 77.10 |
| Total | 7,911 | 100.00 | 165,167,342 | 100.00 | 8,014 | 100.00 | 165,093,922 | 100.00 |
3.2 Resident/Non-Resident Shareholding
| As at 31 December 2015 | As at 31 December 2014 | |||||||
| Shareholding | No. of Shareholders |
% | No. of Shares |
% | No. of Shareholders |
% | No. of Shares |
% |
| Resident | 7,759 | 98.08 | 114,170,880 | 69.12 | 7,865 | 98.14 | 111,113,993 | 67.30 |
| Non-resident | 152 | 1.92 | 50,996,462 | 30.88 | 149 | 1.86 | 53,979,929 | 32.70 |
| Total | 7,911 | 100.00 | 165,167,342 | 100.00 | 8,014 | 100.00 | 165,093,922 | 100.00 |
3.3 Individual/Institutional Shareholding
| As at 31 December 2015 | As at 31 December 2014 | |||||||
| Shareholding | No. of Shareholders |
% | No. of Shares |
% | No. of Shareholders |
% | No. of Shares |
% |
| Individual | 7,479 | 94.54 | 37,048,619 | 22.40 | 7,604 | 94.88 | 32,875,619 | 19.91 |
| Institutional | 432 | 5.46 | 128,118,723 | 77.60 | 410 | 5.12 | 132,218,303 | 80.09 |
| Total | 7,911 | 100.00 | 165,167,342 | 100.00 | 8,014 | 100.00 | 165,093,922 | 100.00 |
4. Twenty Largest Registered Shareholders of the Bank as at 31 December 2015 as per Rule No. 7.6 (iii) of the Listing Rules of the Colombo Stock Exchange
| 2015 | 2014 | |||||
| Name | No. of Shares | % | Name | No. of Shares | % | |
| 1. | Bank of Ceylon No. 1 Account | 16,371,076 | 9.91 | Bank of Ceylon No. 1 Account | 16,371,076 | 9.92 |
| 2. | Employees' Provident Fund | 16,010,248 | 9.69 | Employees' Provident Fund | 16,010,248 | 9.70 |
| 3. | Sri Lanka Insurance Corporation Ltd. - General Fund | 9,388,488 | 5.68 | Sri Lanka Insurance Corporation Ltd. - General Fund | 9,388,488 | 5.69 |
| 4. | HSBC International Nominees Ltd.- SNFE - NTAsian Discovery Master Fund | 8,973,856 | 5.43 | HSBC International Nominees Ltd. - SNFE - NTAsian Discovery Master Fund | 8,973,856 | 5.44 |
| 5. | Dr. S Yaddehige | 8,669,000 | 5.25 | Dr. S Yaddehige | 8,669,000 | 5.25 |
| 6. | Sri Lanka Insurance Corporation Ltd. - Life Fund | 7,805,426 | 4.73 | Sri Lanka Insurance Corporation Ltd. - Life Fund | 7,805,426 | 4.73 |
| 7. | HSBC International Nominees Ltd. - BPSS LUX - Aberdeen Global Asia Pacific Equity Fund | 5,715,450 | 3.46 | HSBC International Nominees Ltd. - BPSS LUX - Aberdeen Global Asia Pacific Equity Fund | 5,715,450 | 3.46 |
| 8. | Employees' Trust Fund Board | 5,592,897 | 3.39 | Employees' Trust Fund Board | 5,303,700 | 3.21 |
| 9. | R S Captain | 5,326,985 | 3.23 | BNY-CF Ruffer Investment Funds: CF Ruffer Pacific Fund | 4,850,000 | 2.94 |
| 10. | Bny-CF Ruffer Investment Funds: CF Ruffer Pacific Fund | 4,850,000 | 2.94 | HSBC International Nominees Ltd. - Msny-Bay Pond Partners L.P. | 4,501,200 | 2.73 |
| 11. | HSBC International Nominees Ltd. - BP2S London - Aberdeen Asia Pacific Equity Fund | 4,294,800 | 2.60 | HSBC International Nominees Ltd. - BP2S London - Aberdeen Asia Pacific Equity Fund | 4,294,800 | 2.60 |
| 12. | Hatton National Bank PLC - A/C No. 01 | 4,282,200 | 2.59 | Hatton National Bank PLC - A/C No. 1 | 4,282,200 | 2.59 |
| 13. | HSBC International Nominees Ltd. - MSNY-BAY Pond Partners L.P. | 3,464,876 | 2.10 | Asian Alliance Insurance PLC - A/C 03 (Life Shareholders Fund) | 3,450,977 | 2.09 |
| 14. | Asian Alliance Insurance PLC A/C 03 (Life Shareholders Fund) | 3,450,977 | 2.09 | A K Pathirage | 2,970,000 | 1.80 |
| 15. | A K Pathirage | 2,970,000 | 1.80 | Asian Alliance Insurance PLC - A/C 01 (General Fund) | 2,540,977 | 1.54 |
| 16. | HSBC International Nominees Ltd. - BBH-Matthews Emerging Asia Fund | 2,515,196 | 1.52 | Asiri Hospital Holdings PLC | 2,411,583 | 1.46 |
| 17. | Asiri Central Hospitals Ltd. | 2,403,447 | 1.46 | Asian Alliance Insurance PLC - A/C 02 (Life Fund) | 2,159,746 | 1.31 |
| 18. | Asian Alliance Insurance PLC - A/C 02 (Life Fund) | 2,159,746 | 1.31 | HSBC International Nominees Ltd. - Msny-Bay Pond Investors (Bermuda) Lp | 2,045,200 | 1.24 |
| 19. | DFCC Bank PLC - A/C 01 | 2,000,000 | 1.21 | DFCC Bank PLC - A/C 01 | 2,000,000 | 1.21 |
| 20. | HSBC International Nominees Ltd. - Bp2s London - Aberdeen Asia Smaller Companies Investment Trust | 1,683,000 | 1.02 | HSBC International Nominees Ltd. - BP2S London - Aberdeen Asia Smaller Companies Investment Trust | 1,683,000 | 1.02 |
| Total | 117,927,668 | 71.40 | Total | 115,426,927 | 69.92 | |
5. Public Shareholding
| 2015 | 2014 | |
| Percentage of the shares held by the public | 90.30% | 90.25% |
| Number of public shareholders | 7,881 | 7,982 |
6. Directors' Interest in Shares of the Bank
| As at 31 December 2015 | As at 31 December 2014 | |
| Name | No. of Shares | No. of Shares |
| N G Wickremeratne | Nil | N/A |
| A K Pathirage | 3,993,000* | 3,993,000* |
| R Theagarajah | 126 | 126 |
| T L F Jayasekera | Nil | Nil |
| Mrs. K Fernando | Nil | Nil |
| D S P Wikramanayake | Nil | Nil |
| Mrs. W A I Sugathadasa | Nil | Nil |
| Mrs. D M A Harasgama | Nil | N/A |
| D M R Phillips | Nil | N/A |
| K D W Ratnayaka | Nil | N/A |
*Includes shares held in the slash account
7. Information on Share Trading
7.1 Share Price Movement Trend Over the Past Five Years
| Year | 2015 | 2014 | 2013 | 2012 | 2011 |
| Highest price (LKR) | 280.00 | 266.00 | 182.50 | 155.00 | 390.00* |
| Date/s highest price was recorded | 23.07.2015 22.05.2015 |
03.10.2014 | 10.05.2013 | 26.09.2012 | 14.02.2011 |
| Lowest price (LKR) | 187.00 | 160.50 | 138.00 | 96.00 | 120.00 |
| Date/s lowest price was recorded | 28.12.2015 | 02.01.2014 | 02.01.2013 | 05.06.2012 | 06.12.2011 |
| Price as at 31 December (LKR) | 194.10 | 250.00 | 160.50 | 137.90 | 138.10 |
| Total number of shares in issue | 165,167,342 | 165,093,922 | 164,693,034 | 164,201,902 | 164,201,902 |
*Unadjusted price for subdivision of shares in 2011.
SHARE PRICE MOVEMENT TREND OVERTHE PAST FIVE YEARS
7.1.1 Share Price Movement Over the Year
| Year 2015 | Jan. | Feb. | Mar. | Apr. | May. | Jun. | Jul. | Aug. | Sep. | Oct. | Nov. | Dec. |
| Highest price | 260.00 | 261.00 | 263.00 | 267.00 | 280.00 | 274.80 | 280.00 | 274.90 | 241.10 | 245.00 | 225.00 | 196.00 |
| Lowest price | 235.00 | 220.00 | 245.00 | 245.00 | 262.00 | 255.00 | 255.00 | 238.00 | 220.00 | 215.00 | 193.50 | 187.00 |
| Price as at month end | 237.40 | 260.00 | 248.00 | 266.40 | 275.00 | 260.30 | 275.00 | 241.00 | 222.30 | 224.00 | 194.80 | 194.10 |
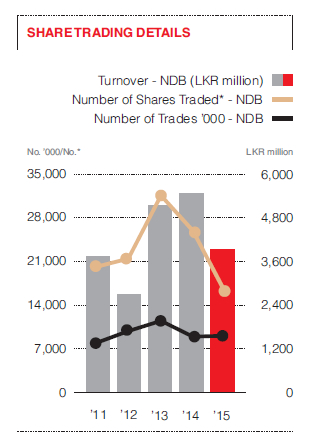
7.2 Share Trading Details
| Year | 2015 | 2014 | 2013 | 2012 | 2011 |
| Number of trades '000 - NDB | 9,040 | 8917 | 11406 | 9854 | 7906 |
| Percentage of total market trades (%) | 0.60 | 0.45 | 0.80 | 0.53 | 0.17 |
| Number of shares traded - NDB | 15,963,879 | 25,871,855 | 31,631,020 | 21,406,492 | 20,108,047 |
| Percentage of total shares traded in the market (%) | 0.17 | 0.15 | 0.35 | 0.22 | 0.08 |
| Turnover - NDB (LKR million) | 3,918 | 5,452 | 5,112 | 2,676 | 3,737 |
| Percentage of total market turnover (%) | 0.60 | 1.60 | 2.55 | 1.25 | 0.68 |
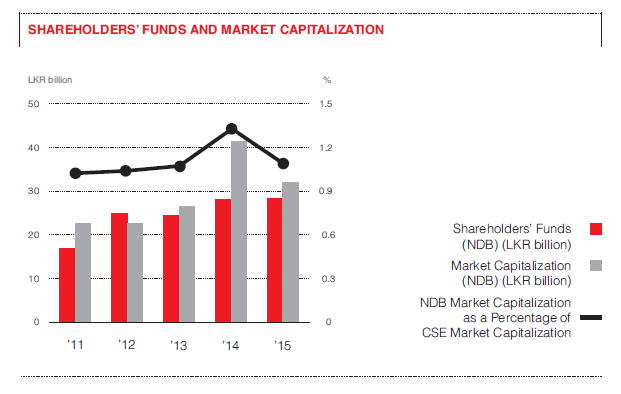
7.3 Shareholders' Funds and Market Capitalization
| Year | 2015 | 2014 | 2013 | 2012 | 2011 |
| Shareholders' funds (NDB) in LKR million | 28,382 | 27,876 | 24,514 | 24,883 | 16,925 |
| Percentage increase/decrease in shareholder funds over the prior year (%) | 2 | 14 | -1 | 47 | 11 |
| Market capitalization (NDB) in LKR million | 32,059 | 41,273 | 26,433 | 22,643 | 22,676 |
| Percentage increase/decrease in NDB market capitalization over the prior year (%) | -22 | 56 | 17 | 0 | -21 |
| Market capitalization (CSE) in LKR million | 2,937,998 | 3,104,864 | 2,459,897 | 2,167,581 | 2,213,873 |
| Percentage increase/decrease in CSE market capitalization over the prior year (%) | -5.37 | 26.22 | 13.49 | -2.09 | 0.15 |
| NDB's market capitalization as a percentage of CSE market capitalization (%) | 1.09 | 1.33 | 1.07 | 1.04 | 1.02 |
| Market capitalization rank of NDB in the CSE | 21 | 16 | 20 | 22 | 23 |
| Market capitalization (BFI sector within CSE) in LKR million | 699,844 | 753,695 | 512,792 | 490,561 | 499,180 |
| NDB's market capitalization as a percentage of BFI sector capitalization (%) | 4.58 | 5.48 | 5.15 | 4.62 | 4.54 |
| Beta value of NDB share against ASPI | 1.37 | 1.11 | 0.82 | 1.17 | 0.86 |
| Beta value of NDB share against S&P SL20 | 1.54 | 1.10 | 0.63 | 1.28 | 0.89 |
SHAREHOLDERS’ FUNDS AND MARKET CAPITALIZATION
Shareholders' funds of the Group reached LKR 28 billion by end 2015, a 2% increase over the prior period. Within shareholder funds, capital increased by 2% whilst retained earnings increased by 3% during the year, strengthening the shareholder funds base.
On a five year compound annual growth basis, the shareholder funds have increase by 11% from 2011 to 2015.
Market capitalization of NDB by the end of 2015 was LKR 32 billion, based on a share base of 165,167,342 which closed trading at LKR 194.10. This was a 22% drop in comparison to the market capitalization in 2014 of LKR 41 billion, which was represented by a share base of 165,093,922 which closed trading at LKR 250.00.
At a market level, the Colombo Stock Exchange also denoted a reduction in the total market capitalization,
NDB retained its position in the S&P SL 20 index , which covers the largest and most liquid stocks from the Sri Lankan equity market, at its latest annual reconstitution in December 2015.
7.4 NDB Share Performance in Comparison to Selected Local Indices
NDB SHARE PRICE MOVEMENT IN COMPARISON TO CSE INDICES
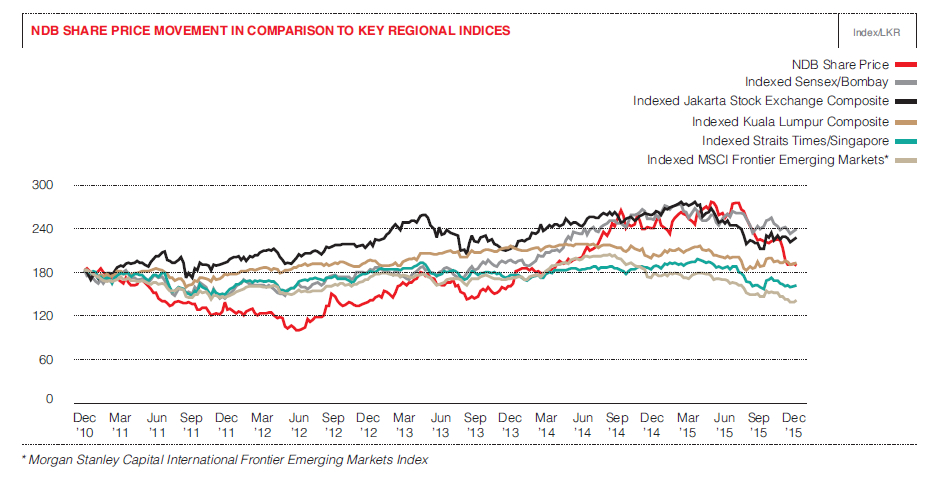
7.5 NDB Share Performance in Comparison to Key Regional Indices
NDB SHARE PRICE MOVEMENT IN COMPARISON TO KEY REGIONAL INDICES
8. Key Shareholder Return Indicators - NDB Group
| Year | 2015 | 2014 | 2013 | 2012 | 2011 |
| Return on equity (%) | 12.59 | 15.78 | 10.70 | 42.35 | 15.69 |
| Gross dividends paid during the year (LKR million) | 1,815 | 1,978 | 3,222 | 657 | 800 |
| Dividend per share (DPS) (LKR) | 11.00 | 11.00 | 10.00 | 15.00 | 7.50 |
| Dividend yield (%) | 5.67 | 4.40 | 6.23 | 10.88 | 5.43 |
| Dividend payout ratio (%) | 51.00 | 43.90 | 62.37 | 79 | 48.71 |
| Earnings per share (EPS) (LKR) | 21.51 | 25.14 | 16.48 | 55.31 | 15.79 |
| Total shareholder return ratio (TSR) (%) | -17.96 | 63.23 | 30.89 | 2.75 | -18.68 |
| Price earnings ratio (PE ratio) (Times) | 9.02 | 9.94 | 9.74 | 2.49 | 8.75 |
| Net asset value per share (LKR) | 172.35 | 169.35 | 148.85 | 151.54 | 103.08 |
| Price to book value (Times) | 1.13 | 1.48 | 1.08 | 0.91 | 1.34 |
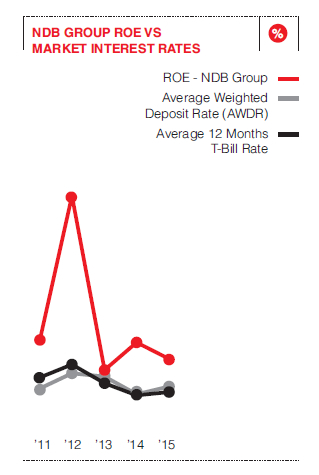
Return on Equity
The Return on Equity (ROE) of the NDB Group for the period under review was 12.59% and compares with an ROE of 15.78% in 2014. The Group has generated sound returns to its shareholders over the years. The Group ROE has been above other comparative market return indicators as well.
NDB GROUP ROE VS MARKET INTEREST RATES
Dividend Policy of the Bank
NDB is one of the few corporates which yields consistently high financial rewarded to its shareholders by way of dividends. To serve this purpose the Bank has been gradually increasing its profitability, whilst maintaining prudential focus on a host of other indicators such as inflation, future cash needs for the sustainable operations of the Bank i.e. liquidity and capital adequacy.
Such focus ensures that the Bank strikes the right balance amongst these crucial indicators of liquidity, capital adequacy and meaningful returns to its shareholders.
The Bank's Board approved dividend policy focuses on maintaining the ratios given below:
| Ratio | Policy Guidelines |
| Dividend payout ratio | >35% |
| Capital adequacy | >12% |
| Open loan position | <40% |
| Liquidity | >20% |
The table below indicates how the Bank has abided by its internal policy for sustainable dividend payments over the past five years which has ensured high dividend to shareholders undisrupted business operations simultaniously.
| Year | 2015 | 2014 | 2013 | 2012 | 2011 |
| Open loan position ratio (%) | 9.64 | 10.05 | 8.69 | 3.95 | 2.73 |
| Capital adequacy ratio (%) | 12.59 | 14.68 | 17.87 | 12.38 | 11.26 |
| Liquidity ratio (%) - DBU | 22.24 | 23.85 | 26.22 | 22.02 | 22.54 |
| Liquidity ratio (%) - FCBU | 24.91 | 25.18 | 26.06 | 24.92 | 28.49 |
| Minimum payout ratio (%) | 35.00 | 35.00 | 35.00 | 35.00 | 35.00 |
| Dividend payout ratio (%) | 51.29 | 43.90 | 62.37 | 79.38 | 48.71 |
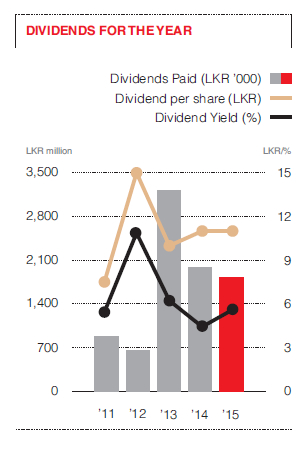
Dividends for the Year
Dividends per share for the year ended 31 December 2015 was LKR 11.00 (2014 - LKR 11.00). The Bank declared an interim dividend of LKR 7.00 (2014 - LKR 7.00) on 13 November 2015 and paid same on 24 November 2015. The final dividend of LKR 4.00 (2014 - LKR 4.00) was declared on 12 February 2016.
The dividend pay-out ratio for 2015 was 51%, and has been maintained well in line with the Bank's dividend policy as explained above.
The dividend yield of the Bank for 2015 was 5.67%.
Earnings Per Share
Basic earnings per share (EPS) for the year ended 31 December 2015 was LKR 21.51 and compared with an EPS of LKR 25.14 in 2014.
As explained in item 12.1 below, the Bank has in effect, an equity linked compensation plan (ELCP) for a set of eligible employees. The diluted earnings per share calculated based on the effect of the said outstanding share option scheme is LKR 21.51.
Total Shareholder Returns
Total shareholder returns (TSR), as measured with change in share price and dividends received during the year was a negative 18% for 2015. The main reason for the negative movement in the TSR was the drop in NDB's share price from LKR 250.00 in end 2014 to LKR 194.10 by end 2015. In terms of dividend earned during 2015 shareholders received a total of LKR 11.00 (LKR 4.00 as final dividend for 2014 and LKR 7.00 as interim dividend for 2015). During 2014, shareholders received a total of LKR 12.00 as dividends (LKR 5.00 as final dividend for 2013 and LKR 7.00 as interim dividend for 2014).
The TSR for 2015 compares with a TSR of 63% in 2014. The main reason for the large positive TSR in 2014 was the NDB's share price appreciation by 56% (a rupee equivalent of LKR 89.50) from end 2013 to end 2014.
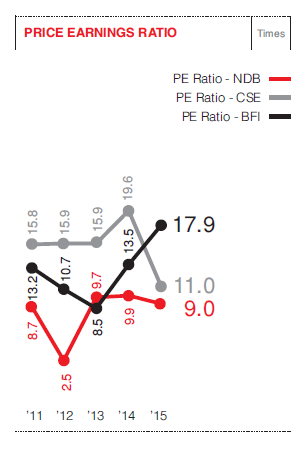
Price Earnings Ratio
The price earnings ratio (PER) of NDB for the 12 months ended 2015 was 9.02 (times). In comparison to the PER of NDB of 9.94 (times) in 2014.
In comparison to the PER of the Colombo Stock Exchange, the Bank's PER has been lower than the CSE PER. The closing CSE PER for 2015 was 18.38 (times). When comparing the PER of NDB with the PER of the Banking, Finance and Insurance (BFI) sector of the CSE, the Bank's PER was still lower than 17.98% of the BFI sector.
Price to Book Value
Price to book value (PBV) was greater than one, for the year ended 31 December 2015 at 1.13 (times) (2014: 1.48 times). The decrease in the share price (from LKR 250.00 to LKR 194.10) together with the increase in the net asset value per share (from LKR 169.35 to LKR 172.35) in end 2015 compared to end 2014 resulted in the lower PBV ratio.
Net Asset Value Per Share
Net asset value per share of the Group improved to LKR 172.35 by the end of 2015 in comparison to LKR 169.35 of end 2014, a modest increase of 2%.
9. Employee Share Ownership Schemes
9.1 Equity Linked Compensation Plan (ELCP)
The Bank obtained approval of the shareholders at an Extraordinary General Meeting held in March 2010, to enable the management staff in the rank of Assistant Vice-President and above of the Bank to take part in the voting ordinary share capital of the Bank, subject to certain limits, terms and conditions, thereby forming an Equity Linked Compensation Plan (ELCP).
Accordingly, the ELCP created a maximum of 3% of the ordinary voting shares to be allocated in five tranches. Half of such shares were to be awarded as share options and the other half as share grants in equal proportions. Each of the five tranches would amount to a maximum of 0.6% of the voting shares.
The said ELCP was concluded in 2014.
However, as per the ELCP, the eligible members of the staff can exercise share options until 2017, and accordingly have exercised share options amounting to 73,420 shares during the year ended 31 December 2015.
The said share issue resulted in the increase of the stated capital of the Bank from LKR 1,225 million to LKR 1,243 million as at 31 December 2015. The number of shares in issue increased from 165,093,922 to 165,167,342 as at 31 December 2015.
More details on the share options scheme and share grants scheme are given on Note 43 to the Financial Statements.
9.2 Employee Share Option Schemes (ESOS)
NDB maintained an Employee Share Option Scheme (ESOP) until 2014. The Colombo Stock Exchange (CSE), by Listing Rule 5.6 amended the rules relating to Employee Share Option Schemes (ESOS) and Employee Share Purchase Schemes (ESPS) by mandating that such schemes should result in the shares being offered to eligible employees for ‘purchase' or ‘subscription' in the case of ESOS and ‘acquisition' in the case of ESPS, specially prohibiting open ended schemes.
In compliance with this ruling and the Transitional Provisions thereto, the Board of Directors of National Development Bank PLC (NDB) approved the dissolution of the NDB ESOP Trust and the distribution of the ESOP shares amounting to 4,133,726 to the eligible employees of NDB in 2014.
Debentures of NDB
10. NDB has Three Debentures in Issue as Follows:
- Listed rated unsecured subordinated redeemable debentures - June 2015
- Listed rated unsecured subordinated redeemable debentures - December 2013
- Unlisted privately placed debentures - June/July 2011
10.1 Rated Unsecured Subordinated Redeemable Debentures - June 2015
10.1 (A) Key Features of the Debentures
| Types of Debentures | Debenture Code | ISIN | Issue Price LKR |
Per Value LKR |
Interest
Rate per Annum |
Interest Payment Frequency |
Annual
Effective Rate per Annum |
Redemption (from the Date of Allotment) |
Interest
Payment Dates |
| Type A | NDB-BD-24/06/20-C2309-9.4 | LK0207D23091 | 100 | 100 | 9.40% | Annually | 9.40% | 60 months (5 years) | 31 December |
| Type B | NDB-BD-24/06/20-C2308-0 | LK0207D23083 | 63.81 | 100 | 9.40% | Annual compounding on the Issue Price payable on the Date of Redemption | 9.40% | 60 months (5 years) | At the time of redemption |
10.1 (B) Trading Details for the Year Ended 31 December 2015
| Type of Debenture | Debenture Capital Balance
as at 31 December 2015 LKR million |
Market Value | Interest Rate of Comparable Security % |
Other Ratios as at Last Trade | |||
| Highest LKR |
Lowest LKR |
Year End LKR |
Interest Yield % |
Yield to Maturity % |
|||
| Fixed rate | |||||||
| Type A | 7,000 | 101.64 | 99.00 | 99.00 | 8.30 | 9.70 | 9.70 |
| Type B | 1,914 | Not traded during the year | 8.30 | Not traded during the year | |||
| Total Debentures | 8,914 | ||||||
10.2 Rated Unsecured Subordinated Redeemable Debentures - December 2013
10.2 (A) Key Features of the Debentures
| Types of Debentures | Debenture Code | ISIN | Issue Price LKR | Per Value LKR | Interest Rate per Annum % | Interest Payment Frequency | Annual Effective Rate per Annum % | Redemption (from the Date of Allotment) | Interest Payment Dates |
| Type A | NDB/BC/19/12/18A13 | LK0207D20998 | 100 | 100 | 13.00 | Semi-Annually | 13.42 | 60 months (5 years) | 30 June and 31 December |
| Type B | NDB/BC/19/12/18B13.4 | LK0207D21012 | 100 | 100 | 13.40 | Annually | 13.40 | 60 months (5 years) | 31 December |
| Type C | NDB/BC/19/12/23C13.9 | LK0207D21038 | 100 | 100 | 13.90 | Annually | 13.90 | 120 months (10 years) | 31 December |
| Type D | NDB/BC/19/12/25D14 | LK0207D21053 | 100 | 100 | 14.00 | Annually | 14.00 | 144 months (12 years) | 31 December |
10.2 (B) Trading Details for the Year Ended 31 December 2015
| Type of Debenture | Debenture Capital Balance
as at 31 December 2015 LKR million |
Market Value | Interest Rate of Comparable Security % |
Other Ratios as at Last Trade | |||
| Highest LKR |
Lowest LKR |
Year End LKR |
Interest Yield % |
Yield to Maturity % |
|||
| Fixed Rate | |||||||
| Type A | 1,243 | 112.00 | 104.00 | 104.00 | 8.30 | 11.39 | 11.39 |
| Type B | 1,529 | 112.35 | 112.35 | 112.35 | 8.30 | 9.04 | 9.04 |
| Type C | 3,638 | 117.05 | 117.05 | 117.05 | 9.75 | 10.78 | 10.78 |
| Type D | 3,590 | Not traded during the year | 9.75 | Not traded during the year | |||
| Total Debentures | 10,000 | ||||||
10.3 Unlisted Privately Placed Debentures - June/July 2011
In 2011, the Bank privately placed rated subordinated unsecured unlisted debentures having an aggregate face value of LKR 400 million. The proceeds of these debentures were utilized for re-lending purposes.
10.3 (A) Key Features of the Debentures
| Date | Amount LKR | Number of Debentures | Value LKR | Redemption | Rate of Interest |
| 30 June 2011 | 1,000/- each | 110,000 | 110,000,000 | 30 June 2016 | 03 month gross TBR + 1.00% per annum |
| 22 July 2011 | 1,000/- each | 290,000 | 290,000,000 | 30 June 2016 | 03 month gross TBR + 1.00% per annum |
10.3 (B) Other Information
| Type of Debenture | CSE Listing | Interest Payable Frequency | Balance as at 31 December 2015 | Coupon Rate % | Effective Annual Yield % | Interest Rate on Comparable Securities % |
| Floating Rate | ||||||
| 2011- 2016 (3 month TB rate (gross)+1% p.a.) | Unlisted | Quarterly | 400 | 7.82 | 7.82 | 6.87 |
| Total Debentures | 400 |
11. Information on Debentures of the Bank (As per Rule No. 7.6 x (i) of the Listing Rules of the Colombo Stock Exchange
| 2015 | 2014 | |
| Debt equity ratio (%) | 12.19 | 10.43 |
| Interest cover (Times) | 1.55 | 1.58 |
| Liquidity assets ratio (%) - Domestic Banking Unit | 22.24 | 23.85 |
| Liquidity assets ratio (%) - Foreign Currency Banking Unit | 24.91 | 25.18 |
12. Directors' Interest in Listed Debentures as at 31 December 2015
| Name | Debenture June 2015 | Debenture December 2014 | ||
| As at 31
December 2015 |
As at 31 December 2014 |
As at 31 December 2015 |
As at 31 December 2014 |
|
| No. of
Debentures |
No. of
Debentures |
No. of
Debentures |
No. of Debentures |
|
| N G Wickremeratne | 75,500 | N/A | 67,200 | N/A*** |
| A K Pathirage | - | N/A | - | - |
| R Theagarajah | - | N/A | - | - |
| T L F Jayasekera | - | N/A | - | - |
| Mrs. K Fernando | - | N/A | - | - |
| D S P Wikramanayake | - | N/A | - | - |
| Mrs. W A I Sugathadasa | - | N/A | - | - |
| Mrs. D M A Harasgama | - | N/A | - | N/A*** |
| D M R Phillips | - | N/A | - | N/A*** |
| K D W Ratnayaka | - | N/A | - | N/A*** |
*** Not Directors as at 2014
Credit Ratings of NDB
13. Credit Ratings
NDB at present engages the services of Fitch Ratings Lanka Ltd. for local credit ratings and the services of Standards and Poor's Rating Services for international ratings.
Ratings assigned to the Bank are subject to annual reviews. In the 2015 annual ratings review, all ratings assigned to NDB by both the rating agencies were affirmed. This is an assured indicator of the soundness with which, the Bank conducts its operations.
14. Credit Ratings Summary
| Rating Entity | Fitch Ratings Lanka Ltd. |
| Date of report | 11 November 2015 |
| National | |
| Long-term rating | AA-(lka) |
| Subordinated debentures | A+(lka) |
| Soveriegn risk | |
| Long-term foreign currency issuer default rating (IDR) | BB- |
| Long-term local currency issuer default rating (IDR) | BB- |
| Outlooks | |
| National Long-Term Rating | Stable |
| Sovereign Long-Term Foreign Currency IDR | Stable |
| Sovereign Long-Term Local Currency IDR | Stable |
| Rating Entity | Standard & Poor's Ratings Services |
| Date of report | 22 June 2015 |
| Counterparty Credit Rating | B+/Stable/B |
| Counterparty Credit Ratings History (27 June 2014) | B+/Stable/B |
15. Full Rating Reports
Please refer our Investor Relations web page within the NDB corporate website on www.ndbbank.com to read the full rating reports of Fitch ratings and Standard & Poor's Rating Services.
Other Information
16. Financial Statements in USD - Group and Bank
16.1 Statement of Profit or Loss
| BANK | GROUP | |||||
| Year ended 31.12.2015 US$ '000 |
Year ended
31.12.2014 US$ '000 |
Change % |
Year ended
31.12.2015 US$ '000 |
Year ended
31.12.2014 US$ '000 |
Change
% |
|
| Gross income | 189,162 | 191,029 | (1) | 196,921 | 200,539 | (2) |
| Interest income | 154,868 | 160,515 | (4) | 156,800 | 161,872 | (3) |
| Interest expenses | 99,837 | 101,782 | (2) | 99,680 | 101,312 | (2) |
| Net interest income | 55,032 | 58,732 | (6) | 57,121 | 60,560 | (6) |
| Net Fee and commission income | 14,751 | 14,282 | 3 | 23,096 | 19,623 | 18 |
| Net gains/(losses) from trading | 7,963 | 6,964 | 14 | 7,963 | 6,964 | 14 |
| Net gains/(losses) from financial investments | 1,917 | 5,483 | (65) | 3,612 | 9,573 | (62) |
| Other operating income | 9,662 | 3,785 | 155 | 5,450 | 2,507 | 117 |
| Total operating income | 89,325 | 89,247 | 0 | 97,242 | 99,227 | (2) |
| Impairment charges for loans receivables and other losses | ||||||
| Individual Impairment | 4,106 | 1,082 | 279 | 4,106 | 1,082 | 279 |
| Collective Impairment | 1,102 | 2,964 | 63 | 1,102 | 2,964 | 63 |
| Other provision | - | 285 | (100) | 251 | - | 100 |
| Net operating income | 5,208 | 4,332 | 20 | 5,459 | 4,046 | 35 |
| Net Operating expenses | 84,116 | 84,915 | (1) | 91,782 | 95,181 | (4) |
| Operating Expenses | ||||||
| Personnel expenses | 23,443 | 21,985 | 7 | 26,584 | 24,278 | 10 |
| Depreciation and amortization | 2,710 | 2,476 | 9 | 3,083 | 2,969 | 4 |
| Other expenses | 18,107 | 16,169 | 12 | 20,301 | 17,986 | 13 |
| Total operating expenses | 44,261 | 40,630 | 9 | 49,970 | 45,233 | 10 |
| Operating profit before tax on financial services | 39,856 | 44,285 | (10) | 41,812 | 49,948 | (16) |
| Tax on financial services | (6,661) | (7,877) | (15) | (6,661) | (7,877) | (15) |
| Operating profit after tax on financial services | 33,196 | 36,408 | (9) | 35,151 | 42,071 | (16) |
| Share of associate companies' profits/(losses) | - | - | - | 569 | 744 | (24) |
| Profit before taxation | 33,196 | 36,408 | (9) | 35,720 | 42,816 | (17) |
| Taxation | (7,506) | (10,251) | (27) | (8,871) | (10,322) | (14) |
| Profit for the period | 25,690 | 26,158 | (2) | 26,849 | 32,494 | (17) |
| Profit attributable to: | ||||||
| Equity holders of the parent | 25,690 | 26,158 | (2) | 25,914 | 31,636 | (18) |
| Non-controlling interests | - | - | - | 937 | 857 | 9 |
| 25,690 | 26,158 | (2) | 26,851 | 32,494 | (17) | |
| Basic Earnings per share (in USD) | 0.16 | 0.16 | (2) | 0.16 | 0.19 | (18) |
| Diluted Earnings per share (in USD) | 0.16 | 0.16 | (2) | 0.16 | 0.19 | (18) |
16.2 Statement of Comprehensive Income
| BANK | GROUP | |||||
| Year ended 31.12.2015 US$ '000 |
Year ended 31.12. 2014 US$ '000 |
Change % |
Year ended
31.12.2015 US$ '000 |
Year ended
31.12. 2014 US$ '000 |
Change % |
|
| Profit for the period | 25,690 | 26,158 | (2) | 26,851 | 32,494 | (17) |
| Other comprehensive income/(expenses) to be reclassified to profit or loss in subsequent periods |
||||||
| Exchange differences on translation of foreign operations | - | - | - | 119 | 4 | (3,125) |
| Gains from available-for-sale investments | (2,863) | (269) | 965 | (2,785) | (168) | 1,558 |
| Deferred tax effect on fair value adjustment of available-for-sale investment | 576 | 258 | 123 | 576 | 258 | 123 |
| Net gains/(losses) on available-for sale investments | (2,287) | (11) | 20,956 | (2,209) | 90 | (2,558) |
| Gains and losses on cash flow hedges | (2,105) | 3,045 | (169) | (2,105) | 3,045 | (169) |
| Other comprehensive income/(expenses) not to be reclassified to profit or loss in subsequent periods |
||||||
| Revaluation of freehold land & buildings | - | 8,297 | (100) | 698 | 8,297 | (92) |
| Deferred tax effect on revaluation surplus | - | (1,766) | (100) | - | (1,766) | (100) |
| Net change in revaluation surplus | - | 6,531 | (100) | 698 | 6,531 | (89) |
| Actuarial gains/(losses) on defined benefit plans | 690 | (1,069) | (165) | 727 | (1,069) | (168) |
| Deferred tax effect on actuarial gains/(losses) on defined benefit plans | (54) | 129 | (141) | (54) | 129 | (141) |
| Net actuarial gains/(losses) on defined benefit plans | 637 | (940) | (168) | 674 | (940) | (172) |
| Total other comprehensive income/(expenses) | (3,755) | 8,625 | (144) | (2,824) | 8,730 | (132) |
| Total comprehensive income for the period | 21,936 | 34,783 | (37) | 24,028 | 41,223 | (42) |
| Attributable to: | ||||||
| Equity holders of the parent | 21,936 | 34,783 | (37) | 23,050 | 40,365 | (43) |
| Non-controlling interests | - | - | - | 978 | 859 | 14 |
| 21,936 | 34,783 | (37) | 24,028 | 41,223 | (42) | |
16.3 Consolidated Statement of Financial Position
| BANK | GROUP | |||||
| Current period
As at 31.12.2015 US$ '000 |
Previous period As at 31.12. 2014 US$ '000 |
Change % |
Current period As at 31.12.2015 US$ '000 |
Previous period
As at 31.12.2014 US$ '000 |
Change % |
|
| Assets | ||||||
| Cash and cash equivalents | 82,094 | 23,536 | 249 | 82,282 | 24,822 | 231 |
| Balances with Central Bank | 48,610 | 51,104 | (5) | 48,610 | 51,104 | (5) |
| Placements with banks | 8,011 | 20,636 | (61) | 8,011 | 20,636 | (61) |
| Derivative financial instruments | 13,219 | 14,434 | (8) | 13,219 | 14,434 | (8) |
| Financial assets-held-for-trading | 20,731 | 21,117 | (2) | 36,316 | 45,706 | (21) |
| Loans and receivables to banks | 713 | 2,359 | (70) | 713 | 2,359 | (70) |
| Loans and receivables to other customers | 1,455,570 | 1,328,091 | 10 | 1,456,011 | 1,328,551 | 10 |
| Financial investments - loans and receivables | 248,822 | 290,390 | (14) | 259,505 | 293,279 | (12) |
| Financial investments - available-for-sale | 197,927 | 129,343 | 53 | 201,145 | 136,906 | 47 |
| Financial investments - held-to-maturity | 30,812 | 68,013 | (55) | 39,312 | 77,084 | (49) |
| Investments held for sale | 129 | 140 | (8) | 231 | 252 | (8) |
| Investments in subsidiary companies | 14,612 | 15,165 | (4) | - | - | - |
| Investment property | - | - | - | 11,611 | 11,719 | (1) |
| Intangible assets | 1,668 | 1,919 | (13) | 1,908 | 2,252 | (15) |
| Property, plant & equipment | 14,097 | 14,613 | (4) | 17,048 | 17,078 | (0) |
| Other assets | 9,912 | 11,021 | (10) | 14,035 | 14,225 | (1) |
| Total assets | 2,146,928 | 1,991,883 | 8 | 2,189,956 | 2,040,406 | 7 |
| Liabilities | ||||||
| Due to banks | 80,694 | 53,293 | 51 | 80,694 | 53,293 | 51 |
| Derivative financial instruments | 4,439 | 5,028 | (12) | 4,439 | 5,028 | (12) |
| Due to other customers | 1,284,259 | 1,151,052 | 12 | 1,278,835 | 1,148,485 | 11 |
| Debt securities issued and other borrowed funds | 420,332 | 469,715 | (11) | 420,124 | 469,491 | (11) |
| Current tax liabilities | 3,378 | 6,268 | (46) | 3,639 | 6,112 | (40) |
| Deferred tax | 4,878 | 4,696 | 4 | 4,950 | 4,624 | 7 |
| Other liabilities | 54,956 | 48,311 | 14 | 56,756 | 50,119 | 13 |
| Dividends payable | 417 | 390 | 7 | 417 | 390 | 7 |
| Subordinated term debts | 135,930 | 84,529 | 61 | 135,930 | 84,529 | 61 |
| Total liabilities | 1,989,283 | 1,823,282 | 9 | 1,985,785 | 1,822,071 | 9 |
| Equity | ||||||
| Stated capital | 8,630 | 9,289 | (7) | 8,076 | 8,683 | (7) |
| Statutory reserve fund | 8,630 | 7,663 | 13 | 8,630 | 7,663 | 13 |
| Retained earnings | 135,030 | 141,209 | (4) | 173,444 | 183,820 | (6) |
| Other reserves | 5,354 | 10,438 | (49) | 6,948 | 11,174 | (38) |
| Total shareholders' equity | 157,645 | 168,599 | (6) | 197,099 | 211,340 | (7) |
| Non-controlling interests | - | - | - | 7,073 | 6,995 | 1 |
| Total equity | 157,645 | 168,599 | (6) | 204,172 | 218,335 | (6) |
| Total liabilities and total equity | 2,146,928 | 1,991,881 | 8 | 2,189,957 | 2,040,406 | 7 |
| Net Book Value Per Share (USD) | 0.95 | 1.02 | (7) | 1.20 | 1.28 | (7) |
| Contingent liabilities and commitments | 1,651,031 | 1,752,416 | (6) | 1,656,872 | 1,752,455 | (5) |
| Memorandum Information | ||||||
| Number of Employees | 1,960 | 1,744 | ||||
| Number of Branches | 93 | 83 | ||||
17. Interim Financial Performance - Group and Bank
17.1 Statement of Profit or Loss
Bank
| LKR '000 | Quarter 4 31.12.2015 | Quarter 3 30.09.2015 | Quarter 2 30.06.2015 | Quarter 1 31.03.2015 | Quarter 4 31.12.2014 | Quarter 3 30.09.2014 | Quarter 2 30.06.2014 | Quarter 1 31.03.2014 |
| Net interest income | 2,015,766 | 1,843,930 | 1,741,914 | 1,920,215 | 1,893,935 | 2,011,647 | 1,973,188 | 1,795,831 |
| Other operating income | 966,482 | 1,141,910 | 868,296 | 1,710,776 | 889,176 | 909,803 | 898,997 | 1,289,390 |
| Total operating income | 2,982,248 | 2,985,840 | 2,610,210 | 3,630,990 | 2,783,111 | 2,921,450 | 2,872,185 | 3,085,221 |
| Impairment for loans & receivables and other losses | 194,664 | 318,872 | 261,799 | (63,502) | 242,428 | 101,449 | 193,633 | 28,493 |
| Net operating income | 2,787,584 | 2,666,968 | 2,348,411 | 3,694,493 | 2,540,683 | 2,820,001 | 2,678,552 | 3,056,728 |
| Total operating expenses | 1,544,025 | 1,556,793 | 1,543,338 | 1,405,424 | 1,393,055 | 1,378,336 | 1,229,405 | 1,308,396 |
| Profit from operations | 1,243,558 | 1,110,175 | 805,073 | 2,289,069 | 1,147,628 | 1,441,665 | 1,449,147 | 1,748,332 |
| Share of associate companies' profit | - | - | - | - | - | - | - | - |
| Profit before taxation | 1,243,558 | 1,110,175 | 805,073 | 2,289,069 | 1,147,628 | 1,441,665 | 1,449,147 | 1,748,332 |
| Taxation | (395,004) | (450,310) | (359,636) | (731,494) | (547,209) | (502,867) | (769,134) | (549,500) |
| Profit for the period | 848,555 | 659,865 | 445,437 | 1,557,574 | 600,419 | 938,798 | 680,013 | 1,198,832 |
| Profit attributable to: | ||||||||
| Equity holders of the parent | 848,555 | 659,865 | 445,437 | 1,557,574 | 600,419 | 938,798 | 680,013 | 1,198,832 |
| Non-controlling interests | - | - | - | - | - | - | - | - |
| 848,555 | 659,865 | 445,437 | 1,557,574 | 600,419 | 938,798 | 680,013 | 1,198,832 | |
| Basic earnings per share (in LKR) | 5.14 | 4.00 | 2.70 | 9.43 | 3.64 | 5.69 | 4.13 | 7.28 |
| Diluted earnings per share (in LKR) | 5.14 | 3.99 | 2.69 | 9.42 | 3.63 | 5.68 | 4.12 | 7.27 |
Group
| LKR '000 | Quarter 4 31.12.2015 | Quarter 3 30.09.2015 | Quarter 2 30.06.2015 | Quarter 1 31.03.2015 | Quarter 4 31.12.2014 | Quarter 3 30.09.2014 | Quarter 2 30.06.2014 | Quarter 1 31.03.2014 |
| Net interest income | 2,102,097 | 1,902,158 | 1,819,330 | 1,983,792 | 1,952,090 | 2,064,925 | 2,033,432 | 1,862,959 |
| Other operating income | 1,576,221 | 1,574,655 | 1,175,198 | 1,157,857 | 1,341,065 | 1,309,395 | 1,035,734 | 1,366,455 |
| Total operating income | 3,678,318 | 3,476,813 | 2,994,528 | 3,141,650 | 3,293,155 | 3,374,320 | 3,069,166 | 3,229,414 |
| Impairment for loans & receivables and other losses | 201,187 | 327,339 | 281,121 | (63,502) | 222,964 | 85,776 | 94,384 | 125,584 |
| Net operating income | 3,477,131 | 3,149,473 | 2,713,407 | 3,205,152 | 3,070,191 | 3,288,544 | 2,974,781 | 3,103,830 |
| Total operating expenses | 1,803,152 | 1,746,450 | 1,718,962 | 1,561,316 | 1,605,584 | 1,522,422 | 1,349,455 | 1,433,155 |
| Profit from operations | 1,673,979 | 1,403,023 | 994,446 | 1,643,836 | 1,464,607 | 1,766,122 | 1,625,326 | 1,670,675 |
| Share of associate companies' profit | - | 14,898 | 15,957 | 46,963 | - | - | - | 97,274 |
| Profit before taxation | 1,673,979 | 1,417,921 | 1,010,403 | 1,690,799 | 1,464,607 | 1,766,122 | 1,625,326 | 1,767,949 |
| Taxation | (332,582) | (562,332) | (426,887) | (801,204) | (527,635) | (514,723) | (772,596) | (563,080) |
| Profit for the period | 1,341,398 | 855,589 | 583,516 | 889,595 | 936,972 | 1,251,400 | 852,730 | 1,204,869 |
| Profit attributable to: | ||||||||
| Equity holders of the parent | 1,254,439 | 843,797 | 574,531 | 869,275 | 857,660 | 1,242,340 | 843,045 | 1,190,885 |
| Non-controlling interests | 86,958 | 11,792 | 8,985 | 20,319 | 79,312 | 9,060 | 9,685 | 13,983 |
| 1,341,398 | 855,589 | 583,516 | 889,595 | 936,972 | 1,251,400 | 852,730 | 1,204,869 | |
| Basic earnings per share (in LKR) | 7.62 | 5.13 | 3.49 | 5.28 | 5.68 | 7.75 | 5.24 | 7.41 |
| Diluted earnings per share (in LKR) | 7.62 | 5.12 | 3.48 | 5.27 | 5.34 | 7.62 | 5.24 | 7.41 |
17.2 Statement of Financial Position
Bank
| LKR '000 | As at
31.12.2015 |
As at 30.09.2015 |
As at
30.06.2015 |
As at
31.03.2015 |
As at
31.12.2014 |
As at
30.09.2014 |
As at
30.06.2014 |
As at |
| Cash and cash equivalents | 19,975,020 | 17,543,429 | 22,411,605 | 23,582,507 | 12,566,872 | 19,509,158 | 9,162,267 | 8,361,127 |
| Net loans and receivables | 209,704,701 | 192,527,763 | 181,435,628 | 175,633,823 | 175,486,347 | 164,951,727 | 153,743,532 | 145,414,432 |
| Investments | 73,876,706 | 62,113,872 | 61,414,034 | 58,134,409 | 69,137,786 | 64,784,042 | 66,953,926 | 50,778,802 |
| Other assets | 5,601,178 | 6,384,483 | 5,667,489 | 6,822,165 | 5,538,141 | 5,603,313 | 3,522,678 | 2,884,388 |
| Total | 309,157,605 | 278,569,547 | 270,928,756 | 264,172,904 | 262,729,146 | 254,848,240 | 233,382,404 | 207,438,749 |
| Customer deposits | 184,933,230 | 169,341,944 | 170,094,950 | 162,760,544 | 151,823,715 | 150,515,133 | 139,500,487 | 135,282,343 |
| Borrowings | 91,721,730 | 75,767,555 | 69,648,348 | 70,632,546 | 80,134,243 | 74,010,835 | 66,633,874 | 47,287,695 |
| Other liabilities | 9,801,787 | 9,616,638 | 7,575,200 | 7,604,820 | 8,532,996 | 7,408,478 | 6,660,594 | 4,964,605 |
| Shareholders Funds | 22,700,858 | 23,843,410 | 23,610,258 | 23,174,994 | 22,238,192 | 22,913,794 | 20,587,448 | 19,904,106 |
| Total | 309,157,605 | 278,569,547 | 270,928,756 | 264,172,904 | 262,729,146 | 254,848,240 | 233,382,404 | 207,438,749 |
| Net asset value per share | 137.44 | 144.36 | 142.95 | 140.37 | 134.70 | 138.84 | 124.77 | 120.84 |
Group
| LKR '000 | As at
31.12.2015 |
As at
30.09.2015 |
As at 30.06.2015 |
As at 31.03.2015 |
As at 31.12.2014 |
As at 30.09.2014 |
As at 30.06.2014 |
As at 31.03.2014 |
| Cash and cash equivalents | 20,002,092 | 17,719,697 | 22,603,704 | 23,791,534 | 12,736,517 | 19,593,374 | 9,356,993 | 8,464,024 |
| Net loans and receivables | 209,768,193 | 192,528,547 | 181,469,407 | 175,659,497 | 175,547,050 | 164,945,855 | 153,767,778 | 145,472,939 |
| Investments | 77,257,188 | 66,234,659 | 64,452,825 | 61,380,473 | 72,970,513 | 68,607,489 | 70,575,810 | 54,259,369 |
| Other assets | 8,326,260 | 8,227,970 | 8,315,231 | 9,164,418 | 7,875,525 | 7,690,060 | 5,474,132 | 4,856,066 |
| Total | 315,353,733 | 284,710,873 | 276,841,167 | 269,995,922 | 269,129,605 | 260,836,778 | 239,174,713 | 213,052,398 |
| Customer deposits | 184,152,280 | 169,039,614 | 169,721,436 | 162,427,534 | 151,485,201 | 150,211,397 | 139,226,384 | 134,984,443 |
| Borrowings | 91,691,730 | 75,737,556 | 69,618,348 | 70,602,547 | 80,104,583 | 74,026,906 | 66,605,559 | 47,257,695 |
| Other liabilities | 10,109,006 | 9,877,556 | 7,889,172 | 7,912,640 | 8,741,402 | 7,536,486 | 6,926,197 | 5,219,171 |
| Shareholders Funds | 28,382,204 | 29,113,108 | 28,684,521 | 28,098,021 | 27,875,773 | 28,218,815 | 25,582,366 | 24,730,358 |
| Non-Controlling Interests | 1,018,513 | 943,039 | 927,690 | 955,180 | 922,646 | 843,174 | 834,207 | 860,731 |
| Total | 315,353,733 | 284,710,873 | 276,841,167 | 269,995,922 | 269,129,605 | 260,836,778 | 239,174,713 | 213,052,398 |
| Net asset value | 172.35 | 176.79 | 174.19 | 170.70 | 169.35 | 175.92 | 159.51 | 154.00 |
18. Ten Years at a Glance (Group Performance)
18.1 Statement of Profit or Loss
| LKR million | 2006 | 2007 | 2008 | 2009 | 2010 | 2011 | 2012 | 2013 | 2014 | 2015 |
| Income | ||||||||||
| Net interest income | 2,853 | 3,522 | 3,787 | 4,233 | 4,163 | 4,910 | 5,896 | 7,012 | 7,913 | 7,807 |
| Other operating income | 2,133 | 1,474 | 1,662 | 2,560 | 2,785 | 3,012 | 9,042 | 4,537 | 5,053 | 5,484 |
| Total operating income | 4,986 | 4,997 | 5,449 | 6,793 | 6,948 | 7,922 | 14,938 | 11,549 | 12,966 | 13,291 |
| Impairment for loans and receivables and other losses | 13 | 65 | 116 | 373 | (172) | (88) | 51 | 1,261 | 529 | 746 |
| Net operating income | 4,972 | 4,932 | 5,333 | 6,420 | 7,119 | 8,010 | 14,887 | 10,288 | 12,437 | 12,545 |
| Less Operating Expenses | ||||||||||
| Personnel costs | 830 | 949 | 1,151 | 1,300 | 1,567 | 2,118 | 2,333 | 2,660 | 3,172 | 3,634 |
| Other operating costs | 929 | 1,104 | 1,237 | 1,370 | 1,496 | 1,863 | 2,163 | 2,904 | 2,738 | 3,196 |
| Total operating expenses | 1,760 | 2,053 | 2,388 | 2,670 | 3,063 | 3,981 | 4,496 | 5,564 | 5,910 | 6,830 |
| Operating Profit before Share of Associate Companies, profit before tax | 3,213 | 2,879 | 2,945 | 3,750 | 4,056 | 4,030 | 10,391 | 4,724 | 6,527 | 5,715 |
| Share of associate companies' profit | 214 | 179 | 172 | 526 | 295 | 331 | 439 | 49 | 97 | 78 |
| Profit before taxation | 3,427 | 3,058 | 3,118 | 4,276 | 4,351 | 4,361 | 10,830 | 4,773 | 6,624 | 5,793 |
| Taxation | (1,220) | (1,421) | (1,409) | (2,154) | (2,175) | (1,597) | (1,898) | (2,061) | (2,378) | (2,123) |
| Profit after taxation | 2,207 | 1,637 | 1,708 | 2,121 | 2,176 | 2,764 | 8,932 | 2,712 | 4,246 | 3,670 |
| Non-controlling interests | (176) | (115) | (103) | (37) | (73) | (235) | (78) | (70) | (112) | (128) |
| Profit attributable to equity holders of the parent | 2,030 | 1,521 | 1,605 | 2,085 | 2,103 | 2,528 | 8,854 | 2,642 | 4,134 | 3,542 |
18.2 Statement of Financial Position
| LKR million | 2006 | 2007 | 2008 | 2009 | 2010 | 2011 | 2012 | 2013 | 2014 | 2015 |
| Assets | ||||||||||
| Liquid assets | 6,042 | 7,748 | 5,883 | 8,243 | 5,586 | 7,651 | 13,269 | 8,139 | 12,737 | 20,002 |
| Investments | 12,170 | 14,701 | 18,509 | 32,128 | 29,199 | 29,992 | 39,587 | 55,614 | 72,971 | 77,257 |
| Loans and receivables | 42,418 | 49,818 | 54,589 | 54,107 | 69,274 | 99,456 | 117,222 | 137,523 | 175,547 | 209,768 |
| Investments in associate companies | 1,179 | 1,210 | 1,393 | 1,724 | 1,763 | 1,797 | 33 | 77 | - | - |
| Property, plant & equipment | 691 | 804 | 781 | 806 | 918 | 1,504 | 1,541 | 1,473 | 2,550 | 2,730 |
| Investment property | 1,200 | 1,200 | 1,200 | 1,200 | 1,200 | 1,296 | 1,296 | 1,384 | 1,546 | 1,672 |
| Other assets | 1,276 | 661 | 925 | 1,075 | 691 | 962 | 1,154 | 2,608 | 3,780 | 3,925 |
| Goodwill | - | - | - | 4 | 4 | - | - | - | - | - |
| Total Assets | 64,977 | 76,143 | 83,280 | 99,286 | 108,635 | 142,588 | 174,103 | 206,818 | 269,130 | 315,354 |
| Liabilities | ||||||||||
| Borrowings | 29,204 | 34,147 | 34,993 | 29,561 | 28,631 | 38,973 | 36,630 | 47,344 | 80,104 | 91,692 |
| Deposits with customers | 21,161 | 25,624 | 31,091 | 49,948 | 60,533 | 82,094 | 107,394 | 129,423 | 151,485 | 184,152 |
| Taxation | 640 | 522 | 352 | 560 | 633 | 397 | 713 | 625 | 1,416 | 1,237 |
| Other liabilities | 2,091 | 2,750 | 3,614 | 4,334 | 2,826 | 3,286 | 3,657 | 4,062 | 7,326 | 8,872 |
| Total Liabilities | 53,096 | 63,043 | 70,050 | 84,403 | 92,623 | 124,750 | 148,394 | 181,454 | 240,331 | 285,953 |
| Shareholders' Funds | ||||||||||
| Stated capital | 1,033 | 1,033 | 1,033 | 1,033 | 864 | 864 | 864 | 944 | 1,145 | 1,163 |
| Statutory reserves | 819 | 819 | 819 | 819 | 879 | 879 | 879 | 959 | 1,011 | 1,243 |
| Other reserves | - | - | - | - | - | 387 | 924 | 1,880 | 1,474 | 1,000 |
| Retained earnings | 8,715 | 9,833 | 10,811 | 12,345 | 13,552 | 14,796 | 22,216 | 20,733 | 24,246 | 24,976 |
| Total shareholders' funds | 10,567 | 11,685 | 12,662 | 14,197 | 15,295 | 16,926 | 24,883 | 24,516 | 27,876 | 28,382 |
| Non-controlling interests | 1,314 | 1,415 | 568 | 687 | 717 | 913 | 826 | 848 | 923 | 1,019 |
| Total funds employed | 11,881 | 13,100 | 13,230 | 14,883 | 16,012 | 17,838 | 25,709 | 25,364 | 28,799 | 29,401 |
| Total liabilities and funds employed | 64,977 | 76,143 | 83,280 | 99,286 | 108,635 | 142,588 | 174,103 | 206,818 | 269,130 | 315,354 |
18.3 Share Information
| 2006 | 2007 | 2008 | 2009 | 2010 | 2011 | 2012 | 2013 | 2014 | 2015 | |
| Market price per share (LKR) | 201.00 | 170.00 | 86.00 | 206.00 | 174.50 | 138.10 | 138.10 | 161.50 | 250.00 | 194.10 |
| Basic earnings per share (LKR) | 12.40 | 9.30 | 9.80 | 12.75 | 12.81 | 15.79 | 55.31 | 16.48 | 25.14 | 21.51 |
| Interim dividends per share (LKR) | - | - | - | - | 4.00 | 3.50 | 5.00 | 5.00 | 7.00 | 7.00 |
| Final dividends per share (LKR) | 4.00 | 6.00 | 6.75 | 8.00 | 4.50 | 4.00 | 10.00 | 5.00 | 4.00 | 4.00 |
| Total dividends per share | 4.00 | 6.00 | 6.75 | 8.00 | 8.50 | 7.50 | 15.00 | 10.00 | 11.00 | 11.00 |
| Dividend cover (Times) | 6.20 | 3.72 | 3.27 | 3.77 | 2.19 | 2.05 | 3.69 | 1.65 | 2.29 | 1.96 |
| Price earnings ratio (Times) | 8.10 | 9.14 | 4.39 | 8.08 | 13.63 | 8.97 | 2.56 | 9.74 | 9.94 | 9.02 |
| Net Asset value per share (LKR) | 64.54 | 71.38 | 77.35 | 86.72 | 93.15 | 103.08 | 151.54 | 148.85 | 169.35 | 172.35 |
19. Compliance Report in terms of Section 7.6 - Contents of the Annual Report in Terms of the Listing Rules of the Colombo Stock Exchange
Tabulated below is how the contents of the Annual Report is complied as specified in Section 7.6 of the Listing Rules issued by the Colombo Stock Exchange. The table provides the disclosure requirements of Section 7.6, the compliance level of the Bank and where you will find the respective disclosures within this Annual Report.
| Rule No. | Disclosure Requirement |
| 7.6 (i) | Names of persons, who during the financial year, were Directors of the entity |
| 7.6 (ii) | Principal activities of the entity and its subsidiaries during the year and any changes therein |
| 7.6 (iii) | The names and the number of shares held by the 20 largest holders of voting shares and the percentage of such shares held |
| 7.6 (iv) | The public holding percentage |
| 7.6 (v) | A statement of each Director's holding and Chief Executive Officer's holding in shares of the entity at the beginning and end of the financial year |
| 7.6 (vi) | Information pertaining to material foreseeable risk factors of the entity |
| 7.6 (vii) | Details of material issues pertaining to employees and industrial relations of the entity |
| 7.6 (viii) | Extents, locations, valuations and the number of buildings of the entity's land holdings and investment properties |
| 7.6 (ix) | Number of shares representing the entity's stated capital |
| 7.6 (x) | A distribution schedule of the number of holders in each class of equity securities, and the percentage of their total holdings in the following categories - No. of holders, holdings, total holdings percentage. |
| 7.6 (xi) | Ratios and market price Information |
|
|
|
|
|
|
| 7.6 (xii) | Significant changes in the entity's or its subsidiaries fixed assets and the market value of land, the value differs substantially from the book value |
| 7.6 (xiii) | Details of the funds raised either through a public issue, rights Issue or private placement; |
|
|
|
|
|
|
| 7.6 (xiv) | Employee Share Option Scheme details |
| Employee Share Purchase Schemes details | |
| 7.6 (xv) | Disclosures pertaining to Corporate Governance practices in terms of Rules 7.10.3, 7.10.5 c. and 7.10.6 c. of Section 7 of the Rules. |
| 7.6 (xvi) | Related party transactions exceeding 10% of the equity or 5% of the total assets of the entity as per Audited Financial Statements, whichever is lower |
Detail of investments in a related party and/or amounts due from a related party. Including details:
- the date of the transaction,
- name of the related party,
- the relationship between the equity and the related party,
- the amount of transaction and terms of the transaction,
- the rationale for entering into the transaction.
20. Shareholder Enquires and Communications
Investor Relations Team
Ms. Suvendrini Muthukumarana
Assistant Vice-President - Finance & Planning
Tel.: + 94 112 448 448/Ext. 3817
Fax: + 94 112 341 047
Email: investor.relations@ndbbank.com
Company Secretarial Division
Ms. Shehani Ranasinghe
Company Secretary
Tel.: + 94 112 448 448/Ext. 33000
Fax: + 94 112 341 050
Email: shehani.ranasinghe@ndbbank.com
Address:
National Development Bank PLC,
No. 40, Navam Mawatha,
Colombo 02,
Sri Lanka