Business Model
The Global Economic Performance*
*Source – World Economic Outlook (January 2016) of the International Monetary Fund (IMF)
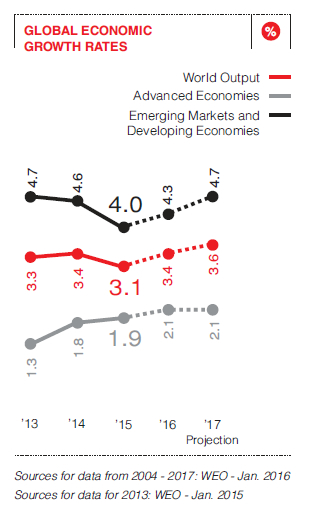
In 2015, global economic activity remained largely subdued. Mixed performance was recorded in the emerging and developing economies and advanced economies, where the former declined in growth for the fifth consecutive year, whilst the latter experienced continuation of modest recovery. Despite the continued decline, emerging and developing economies accounted for 70% of the global growth.
The global economic environment is influenced by the following major factors:
- The gradual slowdown and rebalancing of economic activity in China away from investment and manufacturing, towards consumption and services.
China is evolving in growth as was expected. However, Chinese exports and imports are demonstrating a slowdown which is faster than initially anticipated. These movements in China’s macro-economic indicators are a part reflection of weaker investment and manufacturing activities.
The above mentioned economic behaviour, coupled with market concerns about the future performance of the Chinese economy, are having spillovers to other economies through trade channels and weaker commodity prices, as well as through diminishing confidence and increasing volatility in financial markets. - Lower prices for energy and other commodities
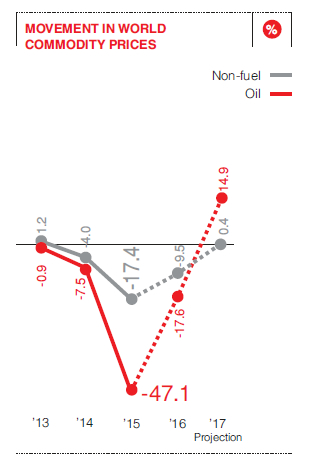
Global oil prices recorded significant reductions starting from September 2015. The reduced prices are causing contrasting impact on the oil importers and exporters. Oil exporters are experiencing strained fiscal positions and subdued growth prospects, whereas importing countries are benefited by the reduced energy costs at both household and business level.
The full positive impact on the global demand and output stemming from reduced oil prices are yet to be realized, due to several factors diminishing the full impact across the globe. - A gradual tightening in monetary policy in the United States in the context of a resilient U.S. recovery as several other major advanced economy central banks continue to ease monetary policy.
In December 2015, the United States Federal Reserve approved a quarter-point increase in its target funds rate, the first rate increase since 2006. In the meantime, monetary easing in the Euro area and Japan continued broadly as expected.
Global Economic Growth Rates – Past and Future
| Projections | |||||
| In % | 2013 | 2014 | 2015 | 2016 | 2017 |
| World output | 3.3 | 3.4 | 3.1 | 3.4 | 3.6 |
| Advanced economies | 1.3 | 1.8 | 1.9 | 2.1 | 2.1 |
| United States | 2.2 | 2.4 | 2.5 | 2.6 | 2.6 |
| Euro area | (0.5) | 0.9 | 1.5 | 1.7 | 1.7 |
| Japan | 1.6 | 0.0 | 0.6 | 1.0 | 0.3 |
| Emerging market and developing economies | 4.7 | 4.6 | 4.0 | 4.3 | 4.7 |
| China | 7.8 | 7.3 | 6.9 | 6.3 | 6.0 |
| India | 5.0 | 7.3 | 7.3 | 7.5 | 7.5 |
| ASEAN | 5.2 | 4.6 | 4.7 | 4.8 | 5.1 |
MOVEMENT IN WORLD COMMODITY PRICES
Sri Lankan Economy*
*Source: Central Bank of Sri Lanka publications.
The Sri Lankan economy grew by 5.2% in the first nine months of 2015 in real Gross Domestic Product (GDP) terms, strengthened by the performance of agriculture, industry and service-related activities. During the said period agriculture, forestry and fishing recorded a growth of 6.1% with a contribution of 7.5% to the overall GDP.
Industry-related activities grew by 3.6% with a contribution of 26.8% to the overall GDP. Service-related activities recorded a growth of 5.2%, and was the highest contributor to GDP with a contribution of 58.4%.
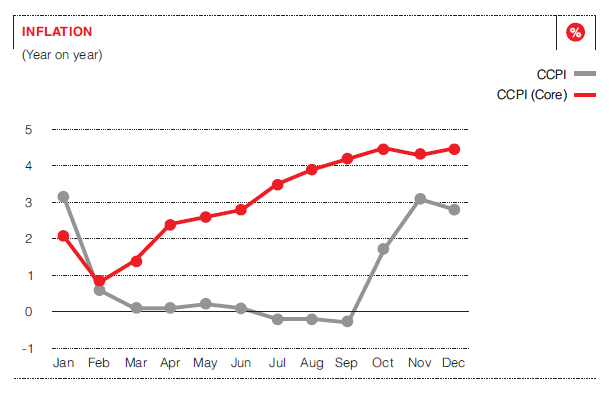
Inflation
Inflation remained at single digit levels during 2015, a continuation of the same trend for seven consecutive years. Prudent demand management policies of the Central Bank of Sri Lanka (CBSL) improved domestic supply conditions and low international commodity prices were the key contributors towards the low inflation levels that were recorded during the year.
Year on year headline inflation dipped to negative territories during the latter half of the year, resulting from the sharp downward adjustments to domestic administered prices of fuel, energy and reduction of prices of selected essential food items by the Government. Core inflation remained below 5% during the year, albeit demonstrating a continued upward trend in its year on year change since early 2015.
External Sector Performance
The country saw moderated external sector performance during the first half of 2015 with a widening current account deficit. Trade deficit expanded due to high domestic demand for imported goods such as vehicles and consumer durables. Trade account inflows related to services increased due to the thriving tourism sector in the country.
The widening current account deficit coupled with the decline in the receipt of foreign direct investment (FDI), portfolio investments and the reversal of foreign investments in Government Securities led to a Balance of Payment (BOP) deficit of USD 792 million by end June 2015, which further widened to USD 2,316 million by end September 2015.
The gross official reserves of Sri Lanka closed at USD 6.8 billion in September 2015, an equivalent of 4.2 months of imports, which increased to around USD 7.3 billion by end 2015.
Exchange Rates
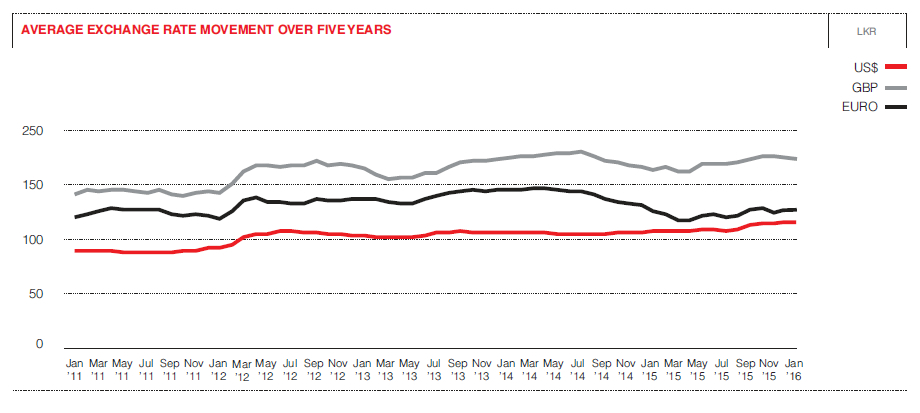
In September 2015, the CBSL decided to limit its intervention in the domestic foreign exchange market, allowing the exchange rate to be largely determined by market forces. Prior to the CBSL’s decision, the Sri Lankan Rupee remained broadly stable. The CBSL supplied USD 1,870 million to the domestic foreign exchange market on a net basis prior to September 2015 to prevent the Rupee from large depreciation, which was under pressure due to several factors. The Sri Lankan Rupee depreciated by 9.0% against the US Dollar during the 2015. The Rupee also depreciated against the Pound Sterling, Japanese Yen and the Indian Rupee and appreciated against the Euro during the same period.
AVERAGE EXCHANGE RATE MOVEMENT OVER FIVE YEARS
Fiscal Sector
The overall fiscal deficit was LKR 573.0 billion for the first nine months of 2015. This was 5.1% of the GDP and compares with 4.8% in the corresponding period of 2014.
The overall fiscal deficit of the first seven months of 2015 was entirely financed through domestic sources, as net foreign financing recorded a repayment during the period.
Monetary Sector
The CBSL maintained a relaxed monetary policy during the the year, to support the domestic economic activities against the backdrop of benign interest rate and inflation expectations. Listed below are few key monetary policy measures adopted by the CBSL during the year:
- March 2015 – Removal of the temporary restriction placed in September 2014 on access to the Standard Deposit Facility (SDF) under open market operations.
- April 2015 – Reduction of the Standard Deposit Facility Rate (SDFR) and the Standard Lending Facility Rate (SLFR) by 50 basis points each. Subsequent to this revision, the SDFR and the SLFR remained at 6.0% and 7.5% respectively, throughout the year.
- December 2015 – Increased the Statutory Reserve Ratio (SRR) applicable to all rupee deposit liabilities of commercial banks by 1.50% points to 7.50% which was effective from the reserve week commencing 16 January 2016.
In addition to the above monetary policy measures, the CBSL also Imposed the following macro-prudential measures:
- A minimum cash margin requirement of 100% against Letters of Credit opened with commercial banks for the importation of motor vehicles – which was effective from 30 October 2015 – 01 December 2015.
- A maximum loan to value (LTV) ratio of 70% in respect of loans and advances granted for the purpose of purchase or utilization of motor vehicles by banks and financial institutions supervised by the CBSL – which was effective from 1 December 2015.
Sri Lankan Banking Sector Performance
Source: Central Bank of Sri Lanka publications.
During 2015, the banking sector of Sri Lanka recorded accelerated growth in assets and profitability. Liquidity was maintained at satisfactory levels with more skewness towards short-term funding. Non-performing loan (NPL) ratio remained relatively low, albeit an increase in volumes of NPLs, with adequate provision coverage. The banking sector also was in compliance with the new capital requirements introduced by BASEL III.
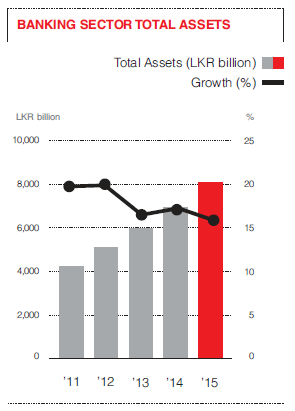
Total Assets
Banking sector total assets exceeded LKR 8 trillion and stood at LKR 8,077 billion by end 2015. Increased demand for credit from both the state and the private sector stimulated this asset growth.
Total Loans and Receivables
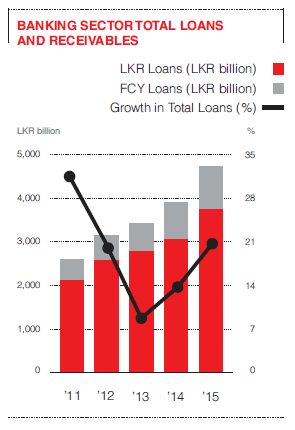
Total loans and receivables reached LKR 4,715 billion by end 2015, which was a 21% year on year growth for the period. Growth in loans and advances were driven by higher demand for credit coupled with lower interest rates. Main sectorial contributors towards the increase were construction, infrastructure, trading and financial and business services sectors.
BANKING SECTOR TOTAL LOANS AND RECEIVABLES
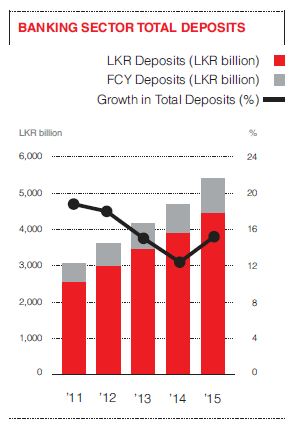
Total Deposits
Total deposits of the banking sector grew by LKR 717 billion to reach LKR 5,403 billion by end of 2015 which translates to a YoY growth of 15%. 83% of total deposits were rupee deposits.
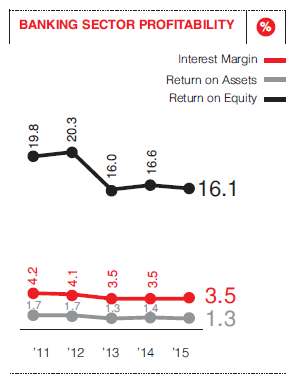
Banking Sector Profitability
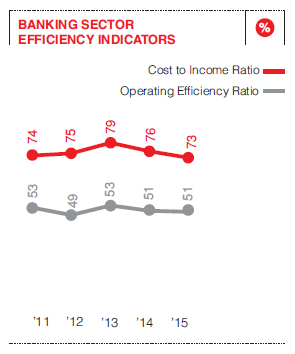
Banking sector recorded increased profitability during the year with Profit After Taxes (PAT) reaching LKR 95.8 billion by end 2015. The main driver of profitability during the period was higher Net Interest Income (NII), which was a results of lower interest expense due to the impact of declining interest rates on deposits. Profitability ratios however, declined marginally by end 2015, in comparison to 2014.
BANKING SECTOR EFFICIENCY INDICATORS
Asset Quality
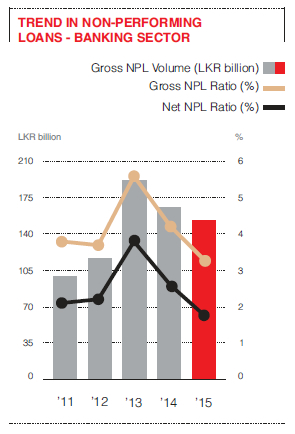
Total gross non-performing loans (NPL) of the banking sector stood at LKR 153 billion by end 2015, a decrease of LKR 12.7 billion from 2014. The gross NPL ratio improved from 4.2% in 2014 to 3.2% by end 2015. NPLS in all major products decreased, expect for NPLS of overdrafts. During December 2015, there was rapid decline in NPLS due to aggressive recovery policies carried out towards the end of the year.
TREND IN NON-PERFORMING LOANS - BANKING SECTOR
Capital Adequacy
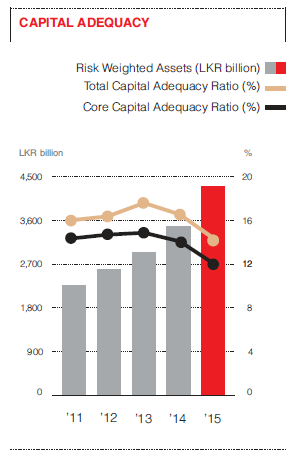
Core capital adequacy ratio and the total capital adequacy ratio (provisional) of the banking sector by end 2015 were 11.9% and 14.2% respectively. Total risk weighted assets stood at LKR 4,297 billion (provisional). Provisional capital adequacy measurements are expected to improve with retained audited profits.
Credit Extended to Private Sector
Credit extended to private sector by commercial banks also increased largely during the year at a year on year growth rate of 21.3% by end August 2015, compared to 8.8% of end 2014. The key drivers of this growth were low market lending rates, increased real wages and increased import demand. The growth is also attributable to the relatively lower levels of credit extended to the private sector in the corresponding period in 2014. The rupee equivalent of increase in credit to the private sector was LKR 310.5 billion denoting a strong demand for banking sector funds.
Expansion of Banking Institutions
Accessibility to banks also improved during the year with an increase in the branch and ATM networks within the country.
| 2015 | 2014 | |
| Total Number of banks | 32 | 34 |
| Number of Licensed Commercial Banks (LCBs) | 25 | 25 |
| Number of Licensed Specialized Banks (LSBs) | 7 | 9 |
| Total number of bank branches | 3,538* | 3,535 |
| Total number of bank ATMs | 3,509* | 3,344 |
* As at September 2015
Banking Sector Consolidation
During 2014, as a step in working towards the then proposed amalgamation between National Development Bank PLC and DFCC Bank, the two banks entered in to a Memorandum of Understanding (MoU) in March 2014. However, the banking sector consolidation initiatives which were pursued in 2014 took a different direction in 2015.
Accordingly, the MoU entered in to by and amongst the two banks was jointly terminated by the two banks in May 2015 with the intention of enabling the two banks to pursue their respective business and expansion strategies unfettered.
In terms of banking sector consolidations, the incumbent Government has encouraged same on a voluntary basis, as a proposal of the 2016 Fiscal Budget. It is expected that, such consolidation will result in stronger balance sheets within the industry, which in turn will enable better ratings and wider access to both domestic and foreign markets.